

The Group’s market risk remains at low levels compared with the aggregates of risks managed by BBVA, particularly in terms of credit risk. This is due to the nature of the business and the Group’s policy of minimal proprietary trading. In 2013, the market risk of the Group’s trading book increased slightly on the previous year to an average economic capital of €233m.
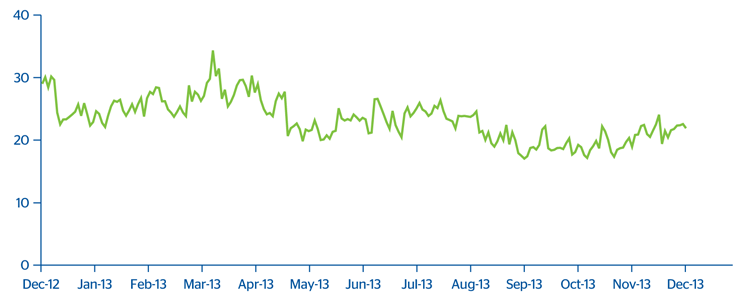
BBVA Group. Market risk in 2013
(VaR, million euros)
The main risk factor in the Group continues to be linked to interest rates, with a weight of 55% of the total at the end of 2013, according to data at the close of 2013 (this figure includes the spread risk). Volatility and correlation risk accounts for 27%, exchange-rate risk for 10% and equity risk, 8%.
BBVA Group. Market risk by factor in 2013
(Million euros)
 Download Excel
| VaR by risk factor | Interest/Spread risk |
Interest-rate Risk |
Equity risk | Vega risk/ correlation |
Diversification effect(1) | Total |
|---|---|---|---|---|---|---|
| Average VaR |
|
|
|
|
|
23 |
| Maximum VaR | 39 | 4 | 2 | 13 | (24) | 34 |
| Minimum VaR | 19 | 3 | 2 | 11 | (18) | 17 |
| End-of-period VaR | 22 | 4 | 3 | 11 | (18) | 22 |
By geographical areas, and as an annual average, 49.2% of the market risk corresponds to the Global Markets in Europe and Global Markets BBVA Compass trading floors and 50.8% to the Group’s banks in Latin America, of which 35.0% is in the Global Markets unit in Mexico.
BBVA Group. Market risk by geographical area
(Average 2013. Percentage)

