

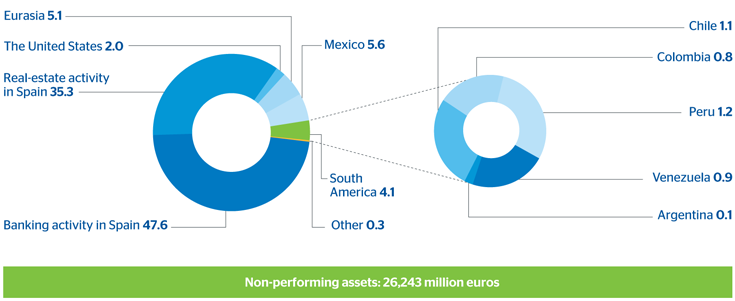
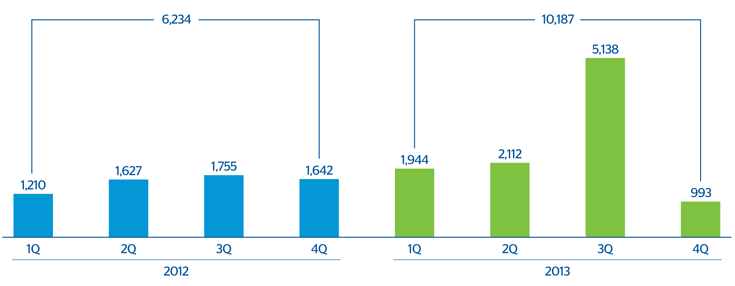
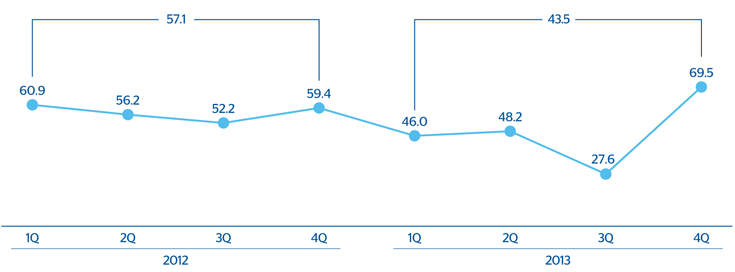
The balance of non-performing assets as of 31-Dec-2013 is €26,243m, €5,640m higher than the figure at the close of December 2012. This was due to the effect of exchange rates and to the fact that the level of non-performing loans in Spain increased significantly over the year as a result of the classification of refinanced loans in both banking and real-estate activity. In terms of variations in NPA, gross additions increased over the last twelve months. Recoveries show a slight decline, with net additions ending the year at €10,187m, up 63.7% on the figure registered at the close of December 2012. As a result, the ratio of recoveries to gross additions to NPA stood at 43.5% in 2013.
BBVA Group. Non-performing assets. Breakdown by business area
(31-12-2013. Percentage)
The following tables show the changes in the period from January 1 to December 31, 2013 for impaired loans and non-performing contingent liabilities, both for the BBVA Group and for each business area.
BBVA Group. Variation in non-performing assets
(Million euros)
 Download Excel
|
|
2013 | 2012 | 2011 |
|---|---|---|---|
| Beginning balance | 20,603 | 15,866 | 15,685 |
| Entries | 18,027 | 14,525 | 13,045 |
| Recoveries | (7,840) | (8,291) | (8,992) |
| Net entry | 10,187 | 6,234 | 4,053 |
| Write-offs | (3,856) | (4,395) | (4,093) |
| Exchange differences and others | (691) | 2,899 | 221 |
| Final balance | 26,243 | 20,603 | 15,866 |
BBVA Group. Variation in non-performing assets by business area
(Million euros)
Download Excel
|
|
Banking activity in Spain | Real-estate activity in Spain | The United States | Eurasia | Mexico | South America | ||||||
|---|---|---|---|---|---|---|---|---|---|---|---|---|
|
|
2013 | 2012 | 2013 | 2012 | 2013 | 2012 | 2013 | 2012 | 2013 | 2012 | 2013 | 2012 |
| Beginning balance | 8,552 | 7,874 | 7,229 | 3,294 | 978 | 1,616 | 1,160 | 701 | 1,489 | 1,275 | 1,122 | 996 |
| Entries | 5,453 | 2,973 | 2,397 | 769 | (41) | (84) | 305 | 594 | 1,395 | 1,370 | 680 | 543 |
| Write-offs | (1,255) | (1,978) | (673) | (266) | (213) | (346) | (60) | (137) | (1,190) | (1,212) | (451) | (437) |
| Exchange differences and others | (269) | (317) | 307 | 3,432 | (211) | (208) | (56) | 3 | (226) | 56 | (243) | 20 |
| Final balance | 12,480 | 8,552 | 9,259 | 7,229 | 513 | 978 | 1,349 | 1,160 | 1,469 | 1,488 | 1,108 | 1,121 |
BBVA Group. Gross additions to NPA
(Million euros)

BBVA Group. Net additions to NPA
(Million euros)
BBVA Group. NPA Recoveries
(Percentage)
The Group’s NPA ratio ended December 2013 at 6.8% (4.6% excluding real-estate activity in Spain), an increase of 1.7 percentage points over the last twelve months. The NPA ratio for the banking business in Spain stands at 6.4%, up 2.4 percentage points over the year. The ratio in real-estate activity in Spain closed at 55.5% (38.3% as of 31-Dec-2012). In Eurasia, the NPA ratio closed December at 3.4% (2.8% as of 31-Dec-2012). In the United States and Mexico, this ratio improved over the year to 1.2% and 3.6%, respectively, as of 31-Dec-2013. Lastly, in South America, the NPA ratio remained stable and closed 2013 at the same level as of 31-Dec-2012, 2.1%.
The Group’s risk premium, which measures the charge against earnings made for net loss provisioning per lending unit, decreased by 57 basis points in 2013 to 1.59%. By geographical area, the risk premium in Spain (including real-estate activity) decreased by 111 basis points to 1.55%, in Eurasia it increased by 14 basis points to 1.11%, in Mexico it stands at 3.57% (3.48% as of 31-Dec-2012) and in South America at 1.49% (1.34% one year before), while in the United States it remains stable at 0.21% (0.19% at the end of 2012).
Lastly, provisions for customer risk totaled €15,715m as of 31-Dec-2013, with the Group’s coverage ratio standing at 60%. By business area, the ratio increased significantly in the United States, from 90% to 134%, while in Eurasia it remained stable (87% at the end of both 2012 and 2013). Slight decreases have been registered in the rest of the geographical areas: in Mexico and South America the ratio closed the year at 110% and 141%, respectively (114% and 146% as of 31-Dec-2012); in banking activity in Spain at 41% (48% at the end of 2012); and in real-estate activity in Spain at 61% (82% as of December 31, 2012).
BBVA Group. Risk premiums by business area
(Percentage)

BBVA Group. NPA and coverage ratios
(Percentage)

