
The main trends in BBVA Group’s balance sheet and business activity in 2013 are summed up below:
1. The exchange rates that influence the Group’s financial statements lost against the euro throughout 2013. As a result, their impact on the balance sheet and activity is negative in the year-on-year comparison of both aggregates.
2. Loans and advances to customers (gross) have fallen on the figure at the end of 2012. This fall was influenced by two elements: first, the negative impact of exchange rates, as already mentioned; second, the decline of lending in Spain, due to the necessary process of deleveraging in the country’s economy, and the early repayment under the Supplier Payment Fund in November.
Consolidated balance sheet (1)
(Million euros)
 Download Excel
|
|
31-12-13 | Δ% | 31-12-12 | 31-12-11 |
|---|---|---|---|---|
| Cash and balances with central banks | 37,064 | (1.0) | 37,434 | 30,939 |
| Financial assets held for trading | 72,301 | (9.6) | 79,954 | 70,602 |
| Other financial assets designated at fair value | 2,734 | (4.2) | 2,853 | 2,977 |
| Available-for-sale financial assets | 80,848 | 13.1 | 71,500 | 58,144 |
| Loans and receivables | 363,575 | (5.2) | 383,410 | 381,076 |
| Loans and advances to credit institutions | 24,203 | (8.7) | 26,522 | 26,107 |
| Loans and advances to customers | 334,744 | (5.2) | 352,931 | 351,900 |
| Other | 4,628 | 16.9 | 3,957 | 3,069 |
| Held-to-maturity investments | - | n.m. | 10,162 | 10,955 |
| Investments in entities accounted for using the equity method | 1,497 | (78.0) | 6,795 | 5,843 |
| Tangible assets | 7,723 | (0.8) | 7,785 | 7,330 |
| Intangible assets | 8,165 | (8.4) | 8,912 | 8,677 |
| Other assets | 25,576 | (11.7) | 28,980 | 21,145 |
| Total assets | 599,482 | (6.0) | 637,785 | 597,688 |
| Financial liabilities held for trading | 45,782 | (18.1) | 55,927 | 51,303 |
| Other financial liabilities at fair value | 2,772 | 10.2 | 2,516 | 1,825 |
| Financial liabilities at amortized cost | 480,307 | (5.2) | 506,487 | 479,904 |
| Deposits from central banks and credit institutions | 87,746 | (17.6) | 106,511 | 92,503 |
| Deposits from customers | 310,176 | 6.0 | 292,716 | 282,173 |
| Debt certificates | 65,497 | (24.9) | 87,212 | 81,930 |
| Subordinated liabilities | 10,579 | (10.6) | 11,831 | 15,419 |
| Other financial liabilities | 6,309 | (23.2) | 8,216 | 7,879 |
| Liabilities under insurance contracts | 9,844 | 9.0 | 9,032 | 7,737 |
| Other liabilities | 15,962 | (20.3) | 20,021 | 16,861 |
| Total liabilities | 554,667 | (6.6) | 593,983 | 557,630 |
| Non-controlling interests | 2,371 | (0.1) | 2,372 | 1,893 |
| Valuation adjustments | (3,866) | 77.0 | (2,184) | (2,787) |
| Shareholders' funds | 46,310 | 6.2 | 43,614 | 40,952 |
| Total equity | 44,815 | 2.3 | 43,802 | 40,058 |
| Total equity and liabilities | 599,482 | (6.0) | 637,785 | 597,688 |
| Memorandum item: |
|
|
|
|
| Contingent liabilities | 36,437 | (7.8) | 39,540 | 39,904 |
3. In 2013, non-performing loans increased significantly, basically in Spain and to a large extent due to the classification of refinanced loans which took place in the third quarter of 2013.
4. Customer funds continued to report an excellent performance throughout the year in all geographical areas, with a favorable impact on the Group’s commercial gap.
- Of these funds deposits from customers were particularly strong, thanks above all to the retail sector and the recovery of wholesale balances.
- The different headings of off-balance-sheet funds also performed positively.
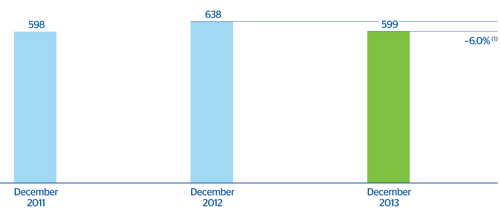
BBVA Group. Total assets
(Billion euros)