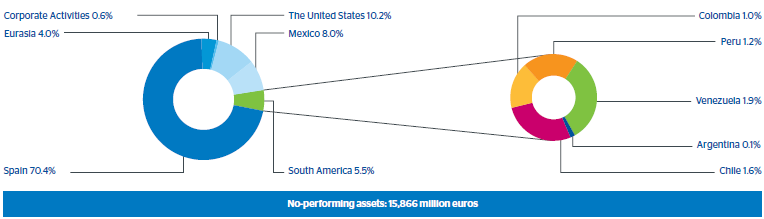

As of December 31, 2011, non-performing loans totaled €15,866m, practically the same level as of December 2009. The year-on-year increase of 1.2% is the result of the acquisition of Garanti. Without this change in the scope of consolidation, there would have been a slight fall compared to December 2010.
The following tables show the changes in the period from January 1 to December 31, 2011 for impaired loans and non-performing contingent liabilities, both for the BBVA Group as a whole and for each business area. Without this change in the scope of consolidation, there would have been a slight fall compared to December 2010.
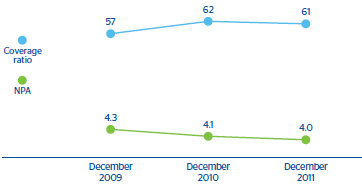
The NPA ratio for the Group closed 2011 at 4.0%, which is down from the figure at the close of 2010 (4.1%). This rate has remained stable over all the quarters in 2011, without surpassing the maximum level reached in December 2009. By business areas, the United States performed particularly well. Its NPA ratio fell by 81 basis points over the year to 3.6% at the end of 2011 (4.4% in 2010). This is mainly the result of the fall in gross additions to NPA. Also remarkable was the performance of South America, where the NPA ratio improved by 26 basis points to 2.2% (2.5% in December 2010). In Spain, the NPA ratio ended the year at the same level as the previous year (4.8%). In Mexico, it stood at 3.5% (3.2% as of 31-Dec-2010). In Eurasia, it increased to 1.5% (0.9% at the close of 2010) due to the acquisition of Garanti.
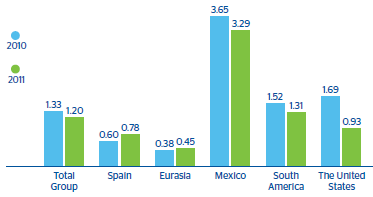
The Group’s risk premium, which measures the charge against earnings made for net loss provisioning per lending unit, improved 13 basis points in 2011 to 1.20%, compared with 1.33% in 2010. By business area, the ratio increased in Spain and Eurasia to 0.78% and 0.45% respectively, while in Mexico decreased 36 basis points, to 3.29%. In South America, the ratio decreased 21 basis points to 1.31%, and in the United States, the decrease was 76 basis points, to 0.93%.
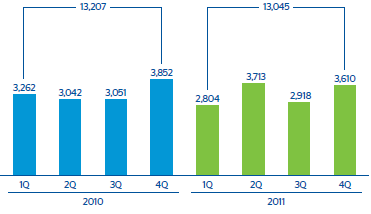
Provisions for customer risk amounted to €9,688m on 31-Dec-2011, a similar figure to that at the end of 2010. Of this total, generic provisions and country risk provisions accounted for €3,218m and represent 33.2% of the total.
Finally, the NPA coverage ratio closed 2011 at 61%. By business areas, the coverage ratio was up in South America to 146% (130% at the end of 2010) and in the United States, where it improved to 73% (61% in 2010). In Spain, it ended the year at the same level as the previous year, 44%. In Eurasia it fell to 123%, also as a result of the acquisition of Garanti (154% as of 31-Dec-2010); and in Mexico to 120% (152% as of 31-Dec-2010), where its fall is due to the early end of the Federal Government’s Punto Final plan in January 2011. It is also important to note that 62% of the risks have associated collateral (58% at the close of 2010).