
Income statement
(Million euros at constant exchange rates)
| Wholesale Banking & Asset Management | 2011 | Growth 12M11/12M10 |
|
|---|---|---|---|
| Absolute | Percentage | ||
| Gross income | 2,724 | (72) | (2.6) |
| Operating income | 1,776 | (207) | (10.4) |
| Income before tax | 1,673 | (110) | (6.2) |
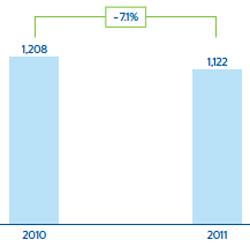
| Net attributable profit | 1,122 | (86) | (7.1) |
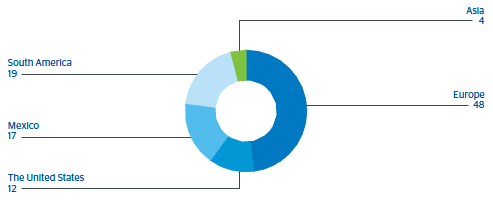
1. Revenue diversification
WB&AM. Gross income breakdown by geographic region
(Percentage)
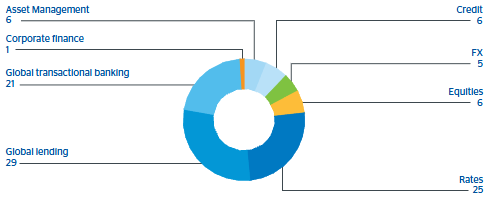
WB&AM. Gross income breakdown by product
(Percentage)
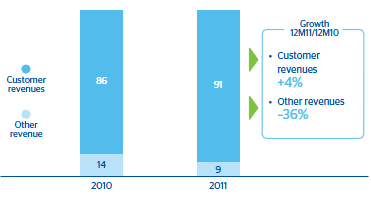
2. Stronger revenue from customers...
WB&AM. Gross income breakdown and evolution
(Percentage)
3. ...And resilience despite adverse conditions
WB&AM. Net attributable profit
(Million euros at constant exchange rates)