
Income statement
(Million euros at constant exchange rate)
| The United States | 2011 | Growth 12M11/12M10 | |
|---|---|---|---|
| Absolute | Percentage | ||
| Net interest income | 1,590 | (128) | (7.4) |
| Gross income | 2,277 | (170) | (7.0) |
| Operating income | 786 | (210) | (21.1) |
| Income before tax | 383 | 81 | 27.0 |
| Net attributable profit (1) | 289 | 54 | 23.2 |
1. Selective growth of business activity
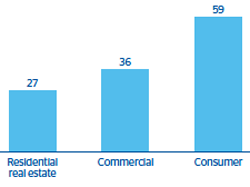
The United States. New production in the main loan portfolios. Year-on-year change
(Percentage at constant exchange rate)
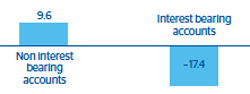
The United States. Customer funds on retail balance sheet. Year-on-year change
(Percentage at constant exchange rate)
2. Good price management
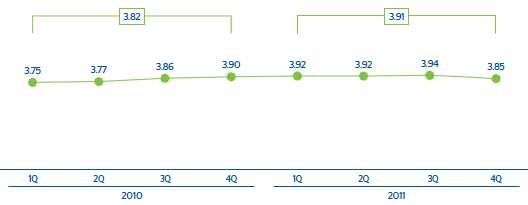
BBVA Compass Banking Group. Customer spread
(Percentage)
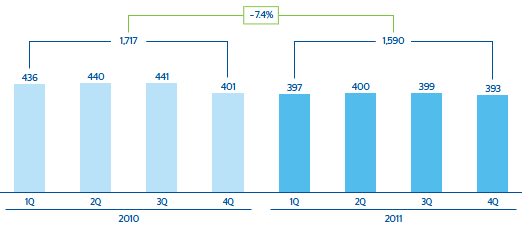
3. Resilient net interest income despite an adverse yield curve
The United States. Net interest income
(Million euros at constant exchange rate)
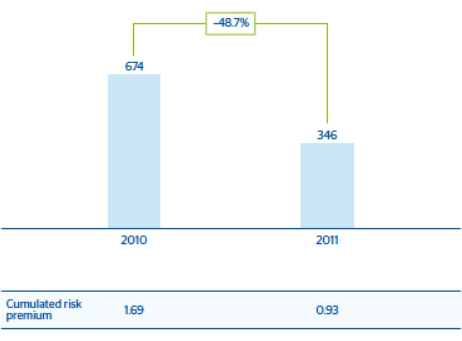
4. Risk levels continue to improve
The United States. Loan-loss provisions
(Million euros at constant exchange rate)
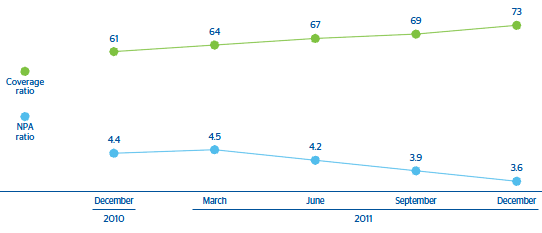
The United States. NPA and coverage ratios
(Percentage)