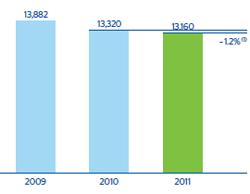

Net interest income in 2011 amounted to €13,160m, barely 1.2% below the figure for 2010, but 1.0% above it disregarding the impact of the exchange rate. In quarterly terms, this item increases quarter after quarter throughout the entire year thanks to various factors: the increased volume of business in emerging countries, the contribution from Garanti and the appropriate price management.
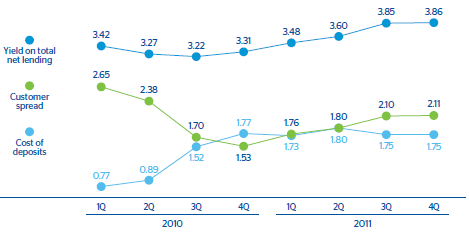
The Group’s efforts to keep spreads wide is obvious across all the geographical areas. In the euro zone resident sector, yields on loans rose by 39 basis points in 2011 and closed the year at 3.69%. This is due to the gradual repricing of the loan portfolio and the positive spreads in new loans. Cost of customer funds went 1.66% up. As a result, customer spreads increased from 2.02% in 2010 to 2.03% as of the close of 2011.
In Mexico, interbank rates remained practically at the same levels throughout 2011. However, the yield on loans increased by 48 basis points over the past twelve months to 13.06%, thanks to the good turnover figures, above all in consumer finance and credit cards. Also, deposit costs fell by one basis point over the same period to 1.87% (1.88% one year before). Thus the customer spread stood at 11.19% (vs 10.71% in 2010) and the net interest income year-to-date in the area went up 7.2% year-on-year at constant exchange rates.
The net interest income in South America continues to post high year-on-year growth rates (up 31.6%, excluding the exchange-rate effect). This positive performance can be explained by the strength of business activity, together with excellent maintenance of spreads in the area.
Finally, the United States franchise continues to be highly resilient in quarterly net interest income at constant exchange rates. This is especially significant taking into account the gradual shift in composition of the loan portfolio toward lower-risk products with narrower spreads. This resilience is the result of a good management of customer spreads.