Expected losses in the performing portfolio, expressed in consolidated terms and adjusted to the economic cycle average, stood at €3,674 million euros as of the close of December 2011, a year-on-year increase of 15.0% homogenous data. In attributable terms, and not including the non-performing portfolio, the expected loss as of December 2011 stood at €3,404m, 13.4% higher than the previous year, considering comparable data.
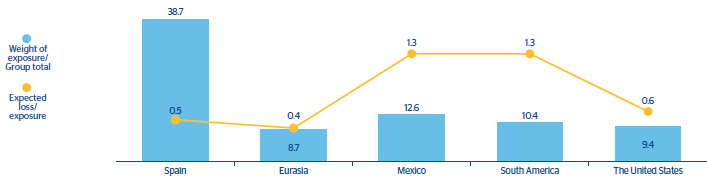
The breakdown of attributable expected losses by business area as of December 31, 2011 is shown in Chart 23. Spain, with an attributed exposure which accounts for 38.7% of the total, has an expected loss-to-exposure ratio of 0.5%. Eurasia accounted for 8.7% of the attributed exposure, with a ratio of 0.3%. Mexico had a weight of 12.6% and a ratio of 1.3%; the United States, 9.4% and 0.6%, respectively; South America, 10.4% and 1.3%.
Risk statistics for the BBVA Group’s main performing portfolios
|
Exposure (1) |
Expected loss (2) |
Economic capital |
| Portfolios |
Million euros |
Million euros |
% |
Million euros |
% |
| Retail Mortgage |
|
|
|
|
|
| Spain |
81,737 |
92 |
0.11 |
1,460 |
1.79 |
| Mexico |
9,033 |
214 |
2.37 |
407 |
4.50 |
| Other |
16,443 |
101 |
0.62 |
344 |
2.09 |
| Total |
107,212 |
407 |
0.38 |
2,211 |
2.06 |
| Other retail portfolios (3) |
|
|
|
|
|
| Spain |
28,482 |
304 |
1.07 |
1,642 |
5.76 |
| Mexico |
11,820 |
500 |
4.23 |
1,278 |
10.81 |
| Other |
26,998 |
739 |
2.74 |
2,110 |
7.81 |
| Total |
67,299 |
1,544 |
2.29 |
5,030 |
7.47 |
| Companies and institutions (4) |
|
|
|
|
|
| Spain |
106,623 |
756 |
0.71 |
4,738 |
4.44 |
| Mexico |
19,690 |
259 |
1.31 |
1,073 |
5.45 |
| Other |
112,149 |
494 |
0.44 |
4,279 |
3.82 |
| Total |
238,462 |
1,509 |
0.63 |
10,090 |
4.23 |
(1) Includes off-balanced sheet positions to which the corresponding conversion factors are applied.
(2) Excludes performing portfolios.
(3) Other retail portfolios = Consumer finance + Credit and debit cards + SME´s + Other retail.
(4) Companies and institutions = Corporate + Companies + Developer + Institutions.
23. BBVA Group. Expected losses (balances not in default) by business area
(Percentage over exposure as of 31-12-2011)