
BBVA has strengthened its growth potential during the crisis
2011: diverse macroeconomic background…
GDP growth in 2011
(Percentage)
|
|
PIB 2011 |
|---|---|
| Emerging (1) | 6.4 |
| The United States | 1.7 |
| Europe (2) | 1.5 |
In which Europe was the main focus of attention.
And that hit the European banking sector through capital, liquidity, risks and earnings.
...In which BBVA has demonstrated high resilience in any scenario

From the capital point of view, BBVA will achieve easily the new capital recommendations of the European Banking Authority (EBA)
BBVA Group. EBA proforma core capital ratio
(Percentage)

In terms of liquidity, the Group ended the year in a very comfortable position for 2012
BBVA has been one of the few European banks with access to the markets, despite the adverse conditions, as shown by its successful issues in 2011. It also shows the lowest 2012 wholesale redemptions of its peer group and has enough additional collateral to absorb any liquidity shocks.
2012 wholesale redemptions
(Billion euros according to 17-01-2012 data)

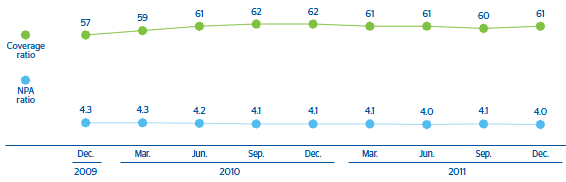
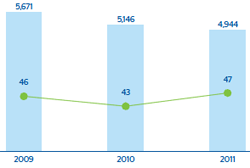
With respect to risk management, the Bank closed the year with a high level of stability in its main indicators
BBVA Group. Non-performing assets
(Billion euros)

BBVA Group. NPA and coverage ratios
(Percentage)
Grupo BBVA. Loan-loss and real estate provisioning
(Million euros/percentage over operating income)
And in terms of earnings, the Bank continued to be highly resilient thanks to its well-balanced and diversified business mix
BBVA Group. Breakdown of net attributable profit by business areas
(Percentage)
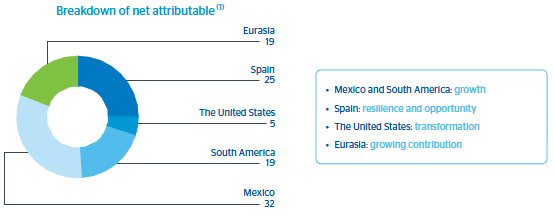
As a result, it has been able to:
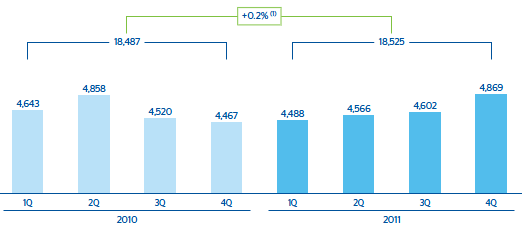
- Generate recurring revenue
BBVA Group. Net interest income
(Million euros)

BBVA Group. Gross income excluding NTI + dividends
(Million euros)
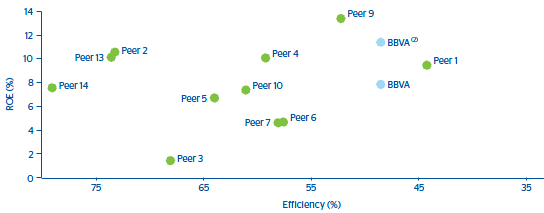
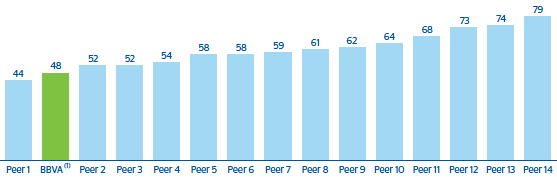
- And anticipate to face the new growth cycle by launching an investment process, without losing its competitive advantage in efficiency (second position in its peer group)
Efficiency. BBVA and peer group
(Percentage)
In short, sound earning figures in turbulent times…
…that make the Group an industry leader and place it in a privileged position from which to face the future, and its major challenges and transformations at both macro and industry levels.
ROE vs. efficiency. BBVA Group vs. peer group (1)
(Percentage)