
BBVA closed 2011 with a balance sheet that continues to reflect great stability, prudent risk management, high solidity, low leverage and reduced funding needs.
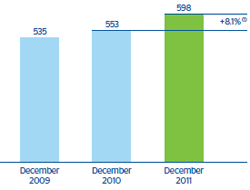
In terms of stability, the Group’s total assets as of 31-Dec-2011 were €598 billion, representing a year-on-year increase of 8.1%, mainly explained by the incorporation of Garanti.
The loan book continues with its twofold performance by geographical area, with a reduction in the most problematic real-estate portfolios in Spain and the United States. In Spain, gross lending to customers fell as a result of the deleveraging process in the country’s economy. Despite this, BBVA gained market share in the residential mortgage portfolio and further reduced its exposure to the developer sector. In Europe, lending remains stable and focused on high added value customers, mainly corporate clients. However, in Garanti, lending continues to grow, above all in consumer loans. The United States is still making progress in shifting its portfolio mix by increasing the weight of target portfolios (residential and commercial real estate). Finally, in Latin America, a region where lending is clearly buoyant, there was a notable increase in practically all the portfolios and categories. Moreover, these rises were of greater quality thanks to the significant proportion of bundled customers.
The more stable lower-cost on-balance sheet customer funds (current and savings accounts) performed particularly well. As a result, their weight on the liabilities side of the balance sheet has increased, thus allowing the Group to continue to improve its funding structure.
With respect to off-balance-sheet funds, market turmoil combined with customer preference for other liability products, such as time deposits and promissory notes, explain the reduction in the amount of assets under management. Nevertheless, BBVA maintains its leading position in Spain in mutual and pension funds, with a fall that is below the system average, thanks to the greater weight of guaranteed funds. Additionally, the Group has a strong leadership position in Latin America, where it is considered a model.
Loans and advances to customers is the main item on the asset side of the balance sheet, representing 58.9% of total assets as of December 31, 2011. On the liabilities side, deposits from customers stood at 47.2% of the total balance sheet at the end of 2011, and thus, the deposit-to-loan ratio closed the year at 80.2%.
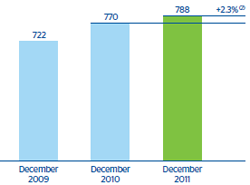
The Group’s business volume, the sum of gross customer lending plus total customer funds, came to €788 billion as of December 31, 2011, and showed a year-on-year increase of 2.3% compared to the €770 billion as of the same date last year. Of this figure, €361 billion corresponded to gross lending and €426 billion to total customer funds, which incorporate both on-balance sheet and mutual and pension funds, as well as customer portfolios. These amounts include neither debt certificates, the heading under which the Spanish retail network has been selling promissory notes since the month of September, nor subordinated liabilities.