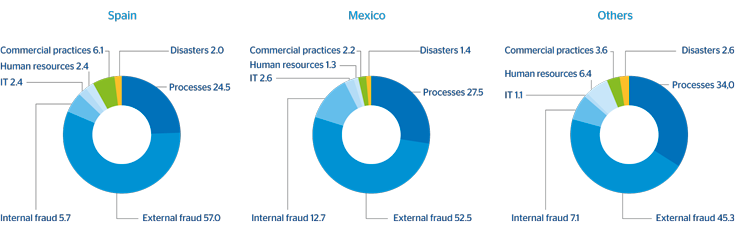

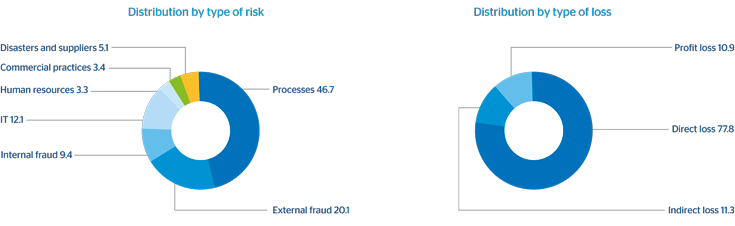
Below are two charts that show BBVA’s operational risk profile. Chart 42 shows the Group’s risk as assessed through the Ev-Ro tool. Chart 43 provides a historical distribution of losses in the different geographical areas where BBVA operates, classified by type of risk.
42 BBVA Group. Risk assessed with the Ev-Ro tool
(Percentage)
43 Historical distribution of losses by type of risk
(Percentage)