

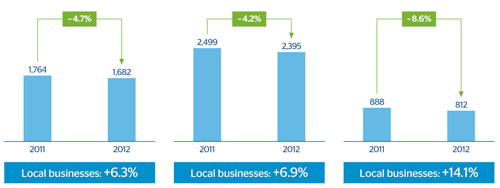
Selective growth of lending and improvement in mix activity
BBVA Compass business activity
(Year-on-year rate as at 31-12-12)

45 Net interest income(Million euros at constant |
Gross income(Million euros at constant |
Operating income(Million euros at constant |
|---|
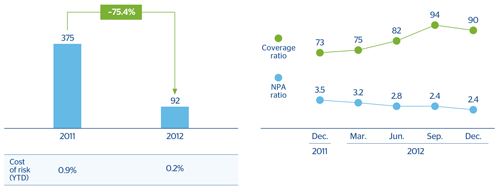
Positive evolution of the asset quality
46 Loan-loss provisions(Million euros at constant exchange rate) |
NPA and coverage ratios(Percentage) |
|---|
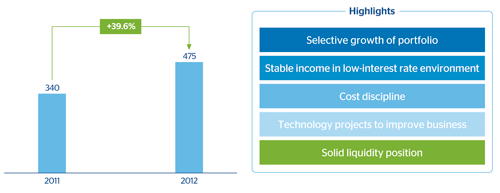
In short, a business transformation reflected in the area’s profit
47 Net attributable profit
(Million euros at constant exchange rate)
Income statement
(Million euros at constant exchange rate)
|
|
Accumulated | Year-on-year change 2012-2011 | |
|---|---|---|---|
|
|
2012 | Absolute | Percentage |
| Net interest income | 1,682 | – 82 | –4.7 |
| Gross income | 2,395 | – 104 | –4.2 |
| Operating income | 812 | – 76 | –8.6 |
| Income before tax | 667 | +1,779 | n.s. |
| Net attributable profit | 475 | +1,229 | n.s. |