

Leading franchise with solid indicators
Business activity
(Year-on-year rate as at 31-12-12)

41 Net interest income
|
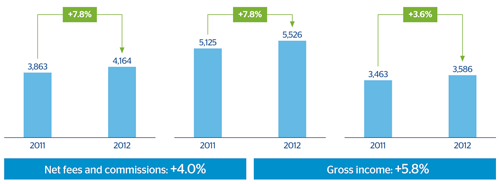
Recurring gross income(Million euros at |
Operating income(Million euros at |
|---|
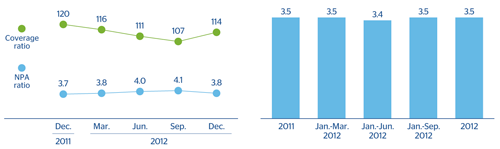
Risk indicators are stable
42 NPA and coverage ratio(Percentage) |
Cost of risk, YTD(Percentage) |
|---|
Income statement
(Million euros at constant exchange rate)
|
|
Accumulated | Year-on-year change 2012-2011 | |
|---|---|---|---|
|
|
2012 | Absolute | Percentage |
| Net interest income | 4,164 | +302 | 7.8 |
| Gross income | 5,758 | +315 | 5.8 |
| Operating income | 3,586 | +124 | 3.6 |
| Income before tax | 2,225 | +30 | 1.4 |
| Net attributable profit | 1,821 | +71 | 4.0 |