

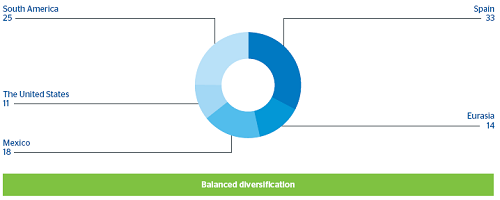
CIB continues to show highly recurrent and resilient earnings. In 2012 it generated gross income of 2,767m, 9.2% up on the figure for the previous year. By geographical areas, revenue grew in South America, Mexico and Spain (up 32.6%, 27.1% and 16.7%, respectively) and fell in Eurasia and the United States (down 27.3% and 9.9%, respectively).
59 CIB. Gross income by geographic area
(Percentage)
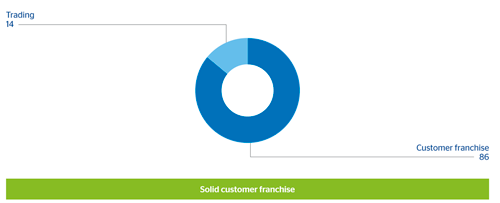
60 CIB. Gross income breakdown by trading and customer franchise
(Percentage)
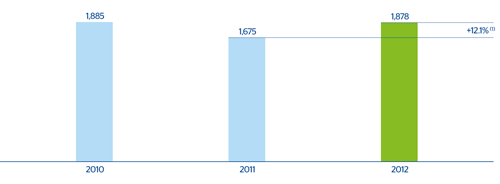
The trend in operating expenses shows the effort made by CIB to contain and control costs. This heading grew by only 3.5% over the previous year, despite the substantial investments made in systems and growth plans in emerging economies. As a result, operating income increased by 12.1% year-on-year to €1,878m.
61 CIB. Efficiency
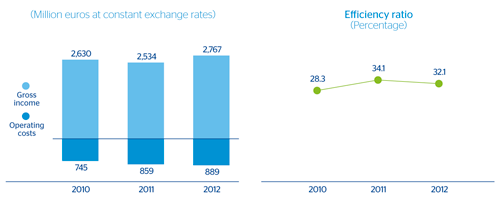
62 CIB. Operating income
(Million euros at constant exchange rates)
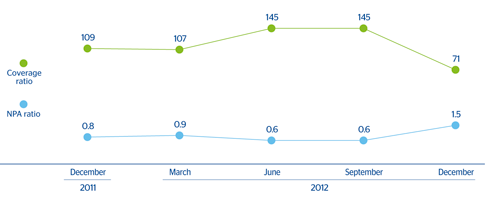
Impairment losses on financial assets amounted to €191m and show the deterioration in the asset quality of certain counterparties due to the current economic downturn. However, the NPA ratio remains low, at 1.5% at the end of 2012.
63 CIB. NPA and coverage ratios
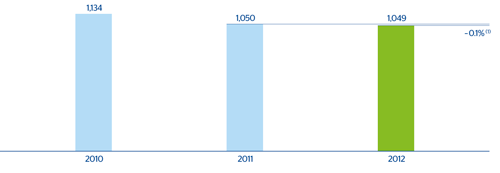
Net attributable profit has continued at similar levels to the previous year, at €1,049m.
64 CIB. Net attributable profit
(Million euros at constant exchange rates)
Below are some of the highlights and most important transactions of the various CIB business units in 2012.