
3 BBVA Group. Net interest income
(Million euros)
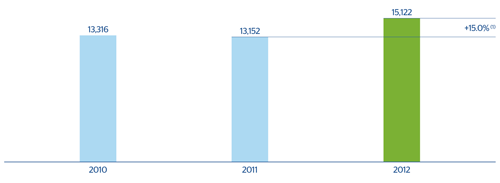
The Group’s cumulative net interest income as of December 2012 amounted to €15,122m, up 15.0% on the same period the previous year. This rise takes place in virtually all geographical areas. It is due, once again, to the maintenance of customer spreads and positive levels of activity in emerging economies. By business areas, the following is worth highlighting:
- Resilience in Spain, in a context of lower volumes, low interest rates and high competition for customer fund gathering, thanks to BBVA’s relatively better liquidity and solvency position. Overall, this area generated cumulative net interest income of €4,836m, with a rise of 10.1% compared with the figure for the same period in 2011.
- Eurasia grew 5.5% year-on-year to an accumulated total of €847m in 2012. The incorporation of Garanti on March 22, 2011, the strong activity with retail customers and the favorable trend in customer spreads, particularly in Turkey (largely due to the reduction in the cost of liabilities), are behind this good performance.
- Mexico reported net interest income of €4,164m in 2012, 7.8% higher than in 2011 at constant exchange rates. Increased activity and adequate price management have enabled BBVA to offset the impact of interest rates, which are at record lows.
- Net interest income in South America continues to perform strongly, benefiting from buoyant activity and the maintenance of customer spreads. Overall, the cumulative figure for the area as of December 2012 is €4,291m, up 25.6% on the same period the previous year (excluding the exchange-rate effect).
- In the United States net interest income continued to be negatively affected by the Guaranty run-off, lower business volume in CIB and the current environment of low interest rates with a practically flat curve. In contrast, the increase in the volume of loans and the year-on-year reduction in the cost of deposits had a positive impact. As a result, this heading stood at €1,682m in 2012, down 4.7% at constant exchanges rates.
Breakdown of yields and costs
 Download Excel
|
|
2012 | 2011 | 2010 | |||
|---|---|---|---|---|---|---|
|
|
% over ATA | % yield/Cost | % over ATA | % yield/Cost | % over ATA | % yield/Cost |
| Cash and balances with central banks | 4.2 | 0.99 | 3.7 | 1.18 | 3.8 | 1.12 |
| Financial assets and derivatives | 26.8 | 2.87 | 24.9 | 2.99 | 26.1 | 2.70 |
| Loans and advances to credit institutions | 4.2 | 1.79 | 4.6 | 2.42 | 4.6 | 1.96 |
| Loans and advances to customers | 57.5 | 5.72 | 60.1 | 5.51 | 59.6 | 4.89 |
| Euros | 34.8 | 3.34 | 38.7 | 3.40 | 39.3 | 3.19 |
| Domestic | 28.8 | 3.79 | 33.8 | 3.69 | 35.6 | 3.30 |
| Other | 6.1 | 1.22 | 4.9 | 1.40 | 3.7 | 2.18 |
| Foreign currencies | 22.7 | 9.39 | 21.5 | 9.31 | 20.3 | 8.19 |
| Other assets | 7.3 | 0.44 | 6.5 | 0.58 | 5.9 | 0.48 |
| Total assets | 100.0 | 4.21 | 100.0 | 4.25 | 100.0 | 3.78 |
| Deposits from central banks and credit institutions | 17.3 | 2.14 | 13.6 | 2.63 | 14.3 | 1.89 |
| Deposits from customers | 45.4 | 1.84 | 48.7 | 2.04 | 46.4 | 1.37 |
| Euros | 23.5 | 1.34 | 27.0 | 1.58 | 21.8 | 1.02 |
| Domestic | 15.3 | 1.57 | 16.9 | 1.66 | 15.8 | 1.28 |
| Other | 8.2 | 0.90 | 10.1 | 1.43 | 6.0 | 0.33 |
| Foreign currencies | 21.9 | 2.38 | 21.7 | 2.62 | 24.6 | 1.68 |
| Debt certificates and subordinated liabilities | 16.7 | 2.71 | 19.3 | 2.38 | 21.4 | 1.95 |
| Other liabilities | 13.8 | 0.94 | 11.6 | 1.11 | 11.9 | 0.62 |
| Equity | 6.9 | - | 6.8 | - | 5.9 | - |
| Total liabilities and equity | 100.0 | 1.79 | 100.0 | 1.94 | 100.0 | 1.40 |
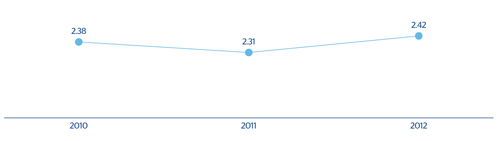
| Net interest income/Average total assets (ATA) |
|
2.42 |
|
2.31 |
|
2.38 |
4 BBVA Group. Net interest income over ATA
(Percentage)