

Business activity
(Year-on-year rate as at 31-12-12)

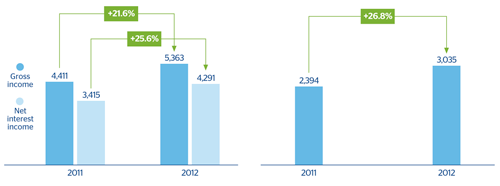
Buoyant business that is reflected by income
43 Net interest income and gross income(Million euros at constant exchange rates) |
Operating income
|
|---|
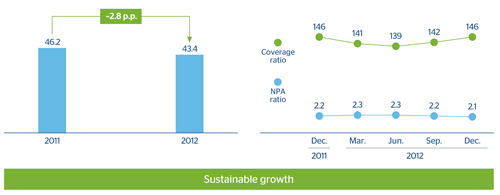
Improvement in efficiency and stable risk indicators
44 Efficiency(Percentage) |
NPA and coverage ratios(Percentage) |
|---|
Income statement
(Million euros at constant exchange rates)
|
|
Accumulated | Year-on-year change 2012-2011 | |
|---|---|---|---|
|
|
2012 | Absolute | Percentage |
| Net interest income | 4,291 | +876 | 25.6 |
| Gross income | 5,363 | +952 | 21.6 |
| Operating income | 3,035 | +641 | 26.8 |
| Income before tax | 2,240 | +429 | 23.7 |
| Net attributable profit | 1,347 | +257 | 23.6 |