
The most significant aspect of operating expenses is their control in developed countries and their growth in emerging areas, in line with the figures mentioned in the quarterly reports for 2012. Between January and December 2012, they totaled €10,786m, with a year-on-year increase of 10.8%. This is due to the investment efforts being made, basically in emerging geographical areas and in technology. The size and scale of the Group have enabled it to undertake significant investments in global technology projects, particularly in the area of transformation and innovation. They have positioned the Bank at the forefront of technological investment in the sector. BBVA started up a number of projects in 2012, including the implementation of the new BBVA Compass technological platform in all its branches in the United States. Progress has also been made in the Group’s multichannel distribution model, of which one example is the launch of “Dinero Móvil BBVA Bancomer” in Mexico.
7 BBVA Group. Operating costs
(Million euros)

Breakdown of operating costs and efficiency calculation
(Million euros)
 Download Excel
|
|
2012 | Δ% | 2011 | 2010 |
|---|---|---|---|---|
| Personnel expenses | 5,662 | 9.1 | 5,191 | 4,698 |
| Wages and salaries | 4,348 | 8.1 | 4,022 | 3,642 |
| Employee welfare expenses | 819 | 9.8 | 746 | 677 |
| Training expenses and other | 495 | 17.1 | 423 | 379 |
| General and administrative expenses | 4,106 | 10.8 | 3,707 | 3,309 |
| Premises | 916 | 9.2 | 839 | 739 |
| IT | 745 | 15.2 | 647 | 551 |
| Communications | 330 | 14.5 | 289 | 274 |
| Advertising and publicity | 378 | 2.4 | 369 | 336 |
| Corporate expenses | 102 | (1.5) | 103 | 86 |
| Other expenses | 1,201 | 8.8 | 1,104 | 1,005 |
| Levies and taxes | 433 | 21.8 | 356 | 318 |
| Administration costs | 9,768 | 9.8 | 8,898 | 8,007 |
| Depreciation and amortization | 1,018 | 21.4 | 839 | 754 |
| Operating costs | 10,786 | 10.8 | 9,737 | 8,761 |
| Gross income | 22,441 | 12.1 | 20,028 | 20,333 |
| Efficiency ratio (Operating costs/Gross income, in %) | 48.1 |
|
48.6 | 43.1 |
This heading has grown well below revenue, making it possible to:
- Improve in the efficiency ratio, which at the end of December stood at 48.1%.
8 BBVA Group. Efficiency

- Maintain its leadership position in efficiency among its peers.
9 Efficiency. BBVA and peer group (1)
(Percentage)

The following are worth highlighting in terms of number of employees, branches and ATMs:
- The number of Group employees as of December 31, 2012 totaled 115,852, an increase of 5,207 people throughout the year.
10 BBVA Group. Number of emplyees (1)

- The number of branches also increased by 521 over the year and totaled 7,978.
11 BBVA Group. Number of branches (1)

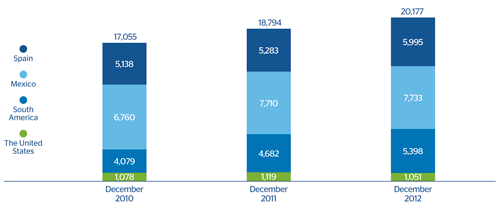
- Lastly, 1,383 new ATMs were installed over the last twelve months, bringing the total number to 20,177 as of 31-Dec-2012. The investment effort made by the Bank in ATMs continues to be notable, as they are considered one of the key differentiating elements in BBVA’s multichannel strategy.
12 BBVA Group. Number of ATMs (1)
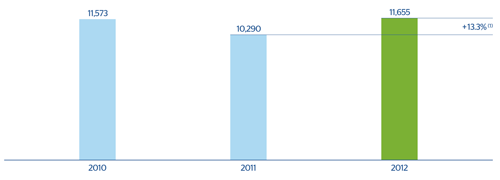
As a result, operating income is up 13.3% over the year to €11,655m. This recurring generation of operating income has laid the sound foundations that have enabled the Bank to absorb the provisions for additional impairment in the value of its real-estate assets in Spain.
13 BBVA Group. Operating income