
The following events are worth noting in second quarter of 2013:
- In Spain, another uptick in the NPA ratio, as expected and in line with the difficult economic situation in the country, with increased gross additions to NPA and a weak lending performance.
- In the United States, there has been an improvement in the NPA and coverage ratios and stability of the risk premium.
- In the rest of geographical areas, risk indicators were practically stable.
The BBVA Group has closed the first half of 2013 with a volume of total risks with customers (including contingent liabilities) below the figure for March 2013, at €401,794m. Exchange rates relative to the euro had a negative impact in this period, as did the fall in lending in Spain and in the Group’s CIB portfolios from developed countries.
Credit risk management (1)
(Million euros)
|
|
30-06-13 | 31-03-13 | 31-12-12 | 30-09-12 | 30-06-12 |
|---|---|---|---|---|---|
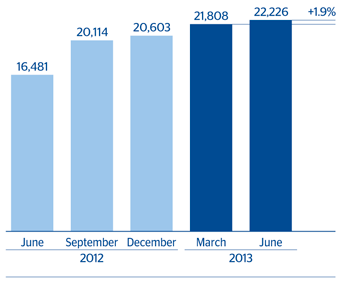
| Non-performing assets | 22,226 | 21,808 | 20,603 | 20,114 | 16,481 |
| Total risks | 401,794 | 410,840 | 407,126 | 417,405 | 409,145 |
| Provisions | 15,093 | 15,482 | 14,804 | 13,877 | 10,822 |
| Specific | 11,084 | 10,719 | 9,752 | 8,503 | 6,867 |
| Generic and country-risk | 4,009 | 4,763 | 5,052 | 5,374 | 3,955 |
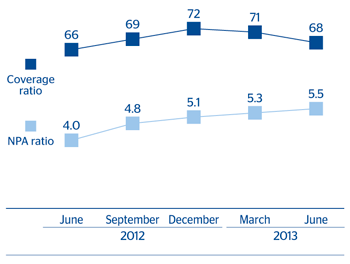
| NPA ratio (%) | 5.5 | 5.3 | 5.1 | 4.8 | 4.0 |
| NPA coverage ratio (%) | 68 | 71 | 72 | 69 | 66 |
Non-performing assets ended the period at €22,226m, up 1.9% on the figure as of 31-Mar-2013. The increase is still concentrated in Spain, where the NPA ratio continues to increase in line with estimates, mainly as a result of the impairment of the commercial loan portfolio. The breakdown of non-performing loans shows that additions to NPA increased by 13.1% in the quarter and recoveries by 18.4%. Net additions thus ended the quarter at €2,112m (up 8.6% over the quarter).
Non-performing assets evolution
(Million euros)
|
|
2Q13 | 1Q13 | 4Q12 | 3Q12 | 2Q12 |
|---|---|---|---|---|---|
| Beginning balance | 21,808 | 20,603 | 20,114 | 16,481 | 16,096 |
| Entries | 4,075 | 3,603 | 4,041 | 3,634 | 3,717 |
| Recoveries | (1,964) | (1,659) | (2,400) | (1,883) | (2,090) |
| Net variation | 2,112 | 1,944 | 1,642 | 1,751 | 1,627 |
| Write-offs | (1,282) | (655) | (1,172) | (1,096) | (1,121) |
| Exchange rate differences and other | (412) | (84) | 19 | 2,979 | (121) |
| Period-end balance | 22,226 | 21,808 | 20,603 | 20,114 | 16,481 |
| Memorandum item: |
|
|
|
|
|
| Non-performing loans | 21,810 | 21,448 | 20,287 | 19,834 | 16,243 |
| Non-performing contingent liabilities | 416 | 361 | 317 | 280 | 238 |
Non-performing assets
(Million euros)
The Group’s NPA ratio as of 30-Jun-2013 was 5.5%, 22 basis points above the figure for the previous quarter. As mentioned above, the main reason behind the increase in the Group’s ratio is the deterioration in Spain’s economic situation, which mainly affects commercial lending, together with decreased business activity in the country. The NPA ratio of the banking business in Spain stands at 4.7%, up 30 basis points over the quarter, while that of real-estate activity in Spain ended the quarter at 43.7% (42.2% as of 31-Mar-2013). In Eurasia, the NPA ratio closed June at 3.0%, while in the United States it improved to 1.5%. In Mexico the rate was 4.0% (3.7% at the close of March 2013). Lastly, in South America the figure was at 2.2%, the same level as the previous quarter.
Coverage provisions for customer risk fell 2.5% against the previous quarter and totaled €15,093m; the decrease is basically due to the effect of exchange rates. Thus, the Group’s coverage ratio closed the quarter at 68%. By business area, banking activity in Spain had a ratio of 45% (50% as of 31-Mar-2013) and real-estate activity posted a figure of 75% (76% at the close of March 2013). The figure in Mexico is 109% (117% as of 31-Mar-2013), in South America 136% (143% three months earlier) and in Eurasia 88% (87% at the close of the first quarter of 2013). Lastly, the figure in the United States has risen to 118% (109% at the close of March).
NPA and coverage ratios
(Percentage)