

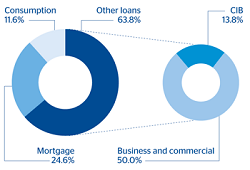
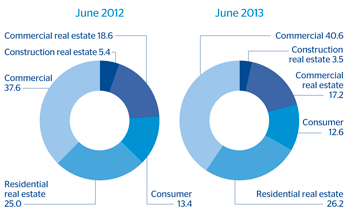
Performing loans managed by this business area as of 30-Jun-2013 amounted to €39,275m, another increase in both year-on-year and quarterly terms (up 1.1% and 3.8%, respectively). Lending growth in the last quarter has been balanced across all portfolios, except for loans to developers (construction real estate), which continues to decline as planned. Of the total amount of lending in the United States, BBVA Compass accounts for 94%. The bank’s commercial loans have increased notably, with a rise of 6.8% over the quarter, while consumer finance and credit cards increased by 2.7% over the same period. Lastly, residential mortgages in BBVA Compass continue to post good rates of growth, with increasingly positive net new production.
As of 30-Jun-2013, all the asset quality metrics in the area showed an improvement once again over the quarter. Non-performing loans are down 15.0% (at current exchange rate), resulting in a new decline in the NPA ratio from 1.8% at the end of March 2013 to 1.5% as of 30-Jun-2013. The coverage ratio increased by more than 9 percentage points over the same period and closed the first half of the year at 118%.
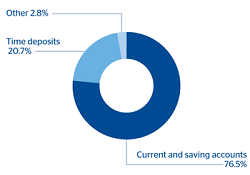
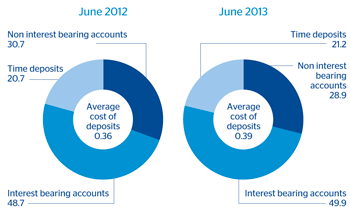
Customer deposits under management in the United States have risen 11.6% year-on-year (up 0.6% over the quarter) to €39,380m. Of this amount, 76.5% corresponds to lower-cost deposits (current and savings accounts), which have seen the biggest rise.
Lastly, BBVA Compass continues to improve its capital position. According to data at the close of the first half of 2013, the Tier I capital ratio stands at 12.0%, a 10-basis point improvement compared to the percentage reported in March, while the total capital ratio amounts to 14.3% (14.1% at the end of the first quarter of 2013).
The United States. Performing loans breakdown(June 2013) |
The United States. Deposits from customers breakdown(June 2013) |
|---|---|
|
|
BBVA Compass. Loan mix(Percentage) |
BBVA Compass. Deposit mix(Percentage) |
|---|---|
|
|