As of December 31, 2010, total non-performing assets stood at €15,685 million, only an €82 million increase over the year. This increase can be fully explained by foreign currency movements, as they were down 1.9% without their impact. This figure is particularly relevant when considering, in the fourth quarter of 2010, the application of extremely prudent criteria in some portfolios in Spain.
The following tables show the changes in the period January 1 to December 31, 2010 for impaired customer loans and doubtful contingent liabilities, both for the BBVA Group as a whole and for each business area.
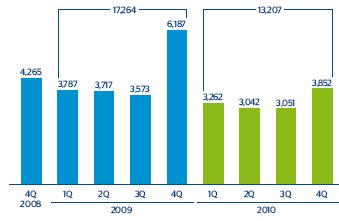
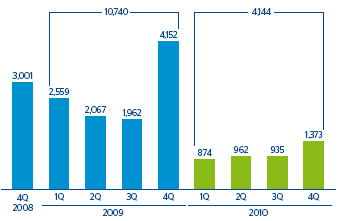
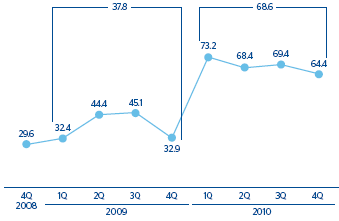
Furthermore, the solid performance of gross additions to NPA throughout the year should also be noted, thanks in part to the proactive measures taken in late 2009 in the areas of Spain and Portugal and the United States. Likewise, the solid performance of recovery throughout the year should also be noted; the ratio of recoveries to new NPA for the year was 68.6%, as compared to 37.8% in 2009.
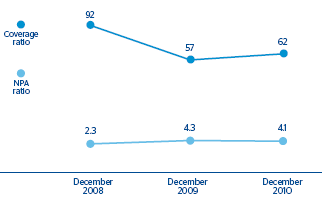
The NPA ratio for the Group closed 2010 at 4.1%, which is down from 2009 (4.3%). This rate has been maintained throughout the year in a controlled manner, without surpassing the maximum level reached one year before. This demonstrates the Group’s success in its proactive efforts carried out in the fourth quarter of 2009, which enabled the stabilization of NPA levels and its differential performance with regards to the main competitors and the industry average. By business area, the strong performance of NPA in Mexico stands out, as it fell more than one percentage point in the year to 3.2%; the NPA ratio in South America fell to 2.5%; and in Spain and Portugal, it improved 10 basis points to close the year at 5.0%. In the other areas, the NPA ratio was practically maintained: Wholesale Banking & Asset Management stands at 1.2% and the United States, 4.4%.
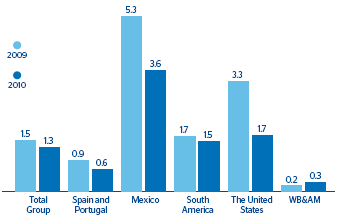
The Group’s risk premium, which measures the charge against earnings made for net loss provisioning per lending unit, improved 21 basis points in 2010 to 1.3%, compared with 1.5% in 2009. By business area, Mexico and the United States decreased by 164 basis points (to 3.6% and 1.7%, respectively); Spain and Portugal fell 28 basis points to 0.6%; and South America dropped 15 basis points to 1.5%.
Coverage provisions for risks with customers rose to €9,655m on 31-Dec-2010, marking an increase of €712m on the figure at the close of 2009. Of this, generic provisions amount to €2,832m and represent 29.3% of the total.
As a result of the increase in the balance of provisions, the coverage ratio of NPA closed 2010 at 62%. Its progress in Mexico is noteworthy, and stands at 152% (130% as of 31-Dec-2009). It remained fairly stable in the other areas: in Spain and Portugal the rate closed at 46% (48% in 2009); in South America it closed at 130% (129% in 2009); it improved to 61% in the United States (58% in 2009); and Wholesale Banking & Asset Management stood at 71% (70% in 2009). Additionally, it is worth considering that 58% of the risks are collateralized.