The South American area manages the BBVA Group’s banking, pension and insurance businesses in the region. The area is quite diversified and has units operating in practically all countries.
The year 2010 was clearly driven by the macroeconomic reactivation, fully consolidated in recent months and closely linked to the strength of domestic demand as well as the high rates of business and consumer confidence have reduced the need for Government fiscal and monetary investment incentive measures applied since 2009. Another positive factor has been commodity prices, which have helped the positive performance of public finances. In these circumstances, the forecasts for GDP growth have been revised upward a number of times over the year, and finally closed above 5%, without any significant inflationary pressures appearing.
The expectations of rises in interest rates explain the moderate upward move in exchange rates in the regional currencies over 2010, except for the Venezuelan bolivar, which suffered a devaluation at the start of the year. The exchange-rate effect is slightly negative in the financial statements for South America, both in terms of the income statements and the balance sheets. As usual, the attached tables include columns with the year-on-year changes at constant exchange rates, to which the following comments refer.
In 2010, the performance of the financial systems in the region has been very favorable, thanks to the high level of liquidity and buoyant domestic demand. For South America the year has featured recovery in all the lines of business, significant progress in revenues, moderation in costs and improved asset quality.
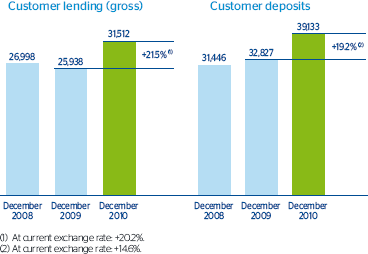
The improvement in revenues is a direct result of the steady increase in the loan book, which closed 2010 at €31,512m, 21.5% up on the previous year, with rises in the individuals and corporate segments. The upturn in lending has not led to a worsening in the level of liquidity in the area, as customer funds have also performed very well, and closed the year at €39,133m in the banking business (including investment funds), 19.2% above the figure for 2009. There was a particularly notable uptrend in transactional products (current and savings accounts were up by 26.0%). The area registered a good deposit/loan ratio of 114.5%. Assets managed by pension fund managers in the area were €48,800m, 17.1% up on the figure for December 31, 2009.
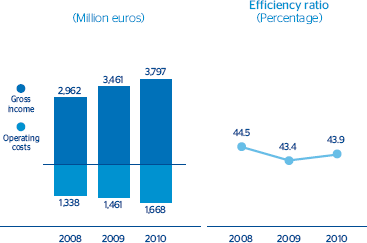
The upturn in activity has offset the effect that the high competitive pressure in the region has on spreads. As a result, the net interest income of €2,495m was 11.1% up on the figure for 2009. The increased business also explains the positive progress in net fees and commissions (up 9.5%), despite the negative effect of the regulatory limitations that entered into force in some countries during the year. Net trading income was good, partly because of the revaluation of BBVA Banco Provincial’s U.S. dollar positions due to the devaluation of the Venezuelan bolivar in January. The other income/expenses items include the adjustment for hyperinflation in Venezuela, which has been more negative than in 2009. Gross income was €3,797m, 9.7% up on the figure for 2009.
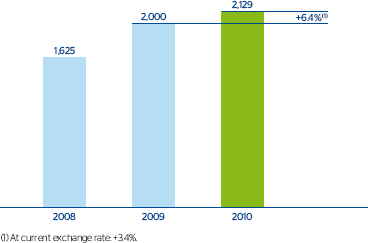
Expenses have been kept in check throughout the year, with a year-on-year growth of 14.2% due to the effect of expansion projects underway in the area. The efficiency ratio remains positive, at 43.9%, and the operating income increased by 6.4% to €2,129m.
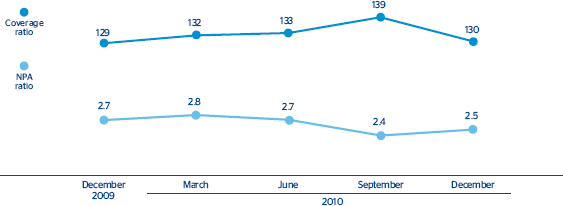
The improvement in asset quality has maintained the volume of NPA practically the same over the year, with a decrease in the NPA ratio to 2.5% (from 2.7% in December 2009). As a result, impairment losses on financial assets were down 4.8% on the figure for 2009, without any negative effect on the level of NPA coverage ratio, which closed 2010 at 130% (compared with 129% as of 31-Dec-2009).
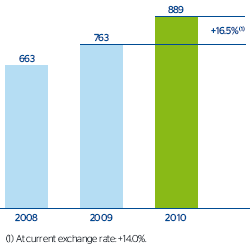
To sum up, the year was very favorable for recurrent revenues, with expenses in check and no increase in loan-loss provisions. This has boosted the net attributable profit in the area to €889m, 16.5% up on the figure in 2009. All the units have also maintained good liquidity and solvency positions.
Income statement
(Million euros)
Download
| |
South America |
Units |
| |
|
Banking businesses |
Pensions and Insurance |
| |
2010 |
D% |
D% (1) |
2009 |
2008 |
2010 |
D% |
D% (1) |
2009 |
2010 |
D% |
D% (1) |
2009 |
| NET INTEREST INCOME |
2,495 |
(2.8) |
11.1 |
2,566 |
2,149 |
2,455 |
(2.8) |
11.3 |
2,527 |
41 |
(4.7) |
(4.4) |
43 |
| Net fees and commissions |
957 |
5.4 |
9.5 |
908 |
775 |
690 |
(1.0) |
10.1 |
697 |
282 |
31.0 |
12.0 |
215 |
| Net trading income |
514 |
26.7 |
13.0 |
405 |
253 |
381 |
35.1 |
19.4 |
282 |
133 |
7.4 |
(2.2) |
124 |
| Other income/expenses |
(168) |
(30.7) |
48.9 |
(242) |
15 |
(298) |
(9.6) |
58.1 |
(329) |
139 |
45.1 |
65.3 |
96 |
| GROSS INCOME |
3,797 |
4.4 |
9.7 |
3,637 |
3,192 |
3,229 |
1.7 |
8.9 |
3,176 |
594 |
24.5 |
15.6 |
477 |
| Operating costs |
(1,668) |
5.6 |
14.2 |
(1,579) |
(1,421) |
(1,413) |
4.9 |
16.8 |
(1,347) |
(239) |
14.9 |
4.9 |
(208) |
| Personnel expenses |
(854) |
7.9 |
15.4 |
(791) |
(725) |
(708) |
7.2 |
18.4 |
(660) |
(120) |
11.5 |
1.4 |
(108) |
| General and administrative expenses |
(684) |
1.6 |
10.9 |
(673) |
(589) |
(581) |
0.6 |
13.1 |
(577) |
(113) |
18.9 |
9.4 |
(95) |
| Depreciation and amortization |
(131) |
14.1 |
24.6 |
(115) |
(107) |
(125) |
14.1 |
26.4 |
(109) |
(7) |
13.5 |
(1.5) |
(6) |
| OPERATING INCOME |
2,129 |
3.4 |
6.4 |
2,058 |
1,770 |
1,815 |
(0.8) |
3.5 |
1,829 |
355 |
32.0 |
24.1 |
269 |
| Impairment on financial assets (net) |
(419) |
(2.8) |
(4.8) |
(431) |
(358) |
(419) |
(1.9) |
(3.9) |
(427) |
- |
(100.0) |
(100.0) |
(4) |
| Provisions (net) and other gains (losses) |
(40) |
(22.1) |
(32.4) |
(52) |
(17) |
(24) |
(14.6) |
(31.3) |
(28) |
(8) |
(34.9) |
(40.6) |
(12) |
| INCOME BEFORE TAX |
1,670 |
6.0 |
11.3 |
1,575 |
1,396 |
1,372 |
(0.1) |
7.0 |
1,374 |
347 |
37.1 |
29.0 |
253 |
| Income tax |
(397) |
(1.7) |
2.0 |
(404) |
(318) |
(323) |
(10.6) |
(6.1) |
(362) |
(89) |
54.4 |
47.3 |
(58) |
| NET INCOME |
1,273 |
8.6 |
14.5 |
1,172 |
1,078 |
1,049 |
3.6 |
11.7 |
1,012 |
258 |
32.0 |
23.7 |
195 |
| Non-controlling interests |
(383) |
(2.1) |
10.2 |
(392) |
(351) |
(317) |
(5.2) |
9.9 |
(335) |
(67) |
16.2 |
12.3 |
(58) |
| NET ATTRIBUTABLE PROFIT |
889 |
14.0 |
16.5 |
780 |
727 |
732 |
8.0 |
12.6 |
678 |
191 |
38.7 |
28.4 |
137 |
(1) At constant exchange rate.
Balances
(Million euros)
Download
| |
31-12-10 |
D% |
D% (1) |
31-12-09 |
31-12-08 |
31-12-10 |
D% |
D% (1) |
31-12-09 |
31-12-10 |
D% |
D% (1) |
31-12-09 |
| Cash and balances with central banks |
7,064 |
21.0 |
42.6 |
5,837 |
5,512 |
7,064 |
21.0 |
42.6 |
5,837 |
- |
- |
- |
- |
| Financial assets |
8,550 |
11.2 |
10.3 |
7,688 |
5,854 |
6,671 |
(5.0) |
(5.8) |
7,021 |
1,860 |
73.8 |
63.8 |
1,070 |
| Loans and receivables |
33,845 |
19.7 |
22.8 |
28,269 |
27,836 |
33,067 |
18.9 |
22.1 |
27,810 |
563 |
(5.9) |
(12.5) |
598 |
| . Loans and advances to customers |
30,408 |
20.4 |
21.9 |
25,256 |
24,405 |
30,228 |
20.7 |
22.2 |
25,041 |
197 |
(17.2) |
(19.8) |
238 |
| . Loans and advances to credit institutions and other |
3,437 |
14.1 |
31.2 |
3,013 |
3,430 |
2,839 |
2.5 |
20.9 |
2,769 |
366 |
1.6 |
(8.0) |
361 |
| Tangible assets |
652 |
0.6 |
10.1 |
648 |
478 |
596 |
(0.6) |
11.1 |
600 |
56 |
15.7 |
0.5 |
48 |
| Other assets |
1,551 |
(19.9) |
(19.7) |
1,936 |
1,922 |
1,383 |
(2.6) |
(3.1) |
1,420 |
130 |
134.4 |
173.8 |
56 |
| TOTAL ASSETS / LIABILITIES AND EQUITY |
51,663 |
16.4 |
20.7 |
44,378 |
41,600 |
48,781 |
14.3 |
18.8 |
42,687 |
2,610 |
47.2 |
38.6 |
1,773 |
| Deposits from central banks and credit institutions |
4,299 |
39.0 |
30.3 |
3,092 |
3,674 |
4,295 |
39.2 |
30.4 |
3,086 |
4 |
(57.0) |
(58.6) |
9 |
| Deposits from customers |
33,496 |
14.3 |
22.1 |
29,312 |
27,921 |
33,605 |
14.2 |
21.9 |
29,427 |
- |
- |
- |
- |
| Debt certificates |
1,864 |
19.9 |
4.6 |
1,554 |
1,243 |
1,864 |
19.9 |
4.6 |
1,554 |
- |
- |
- |
- |
| Subordinated liabilities |
1,331 |
8.3 |
2.7 |
1,229 |
1,240 |
1,171 |
59.8 |
46.5 |
733 |
- |
- |
- |
- |
| Financial liabilities held for trading |
876 |
28.8 |
10.8 |
680 |
1,005 |
876 |
28.8 |
10.8 |
680 |
1 |
n.m. |
n.m. |
- |
| Other liabilities |
7,407 |
17.1 |
24.8 |
6,326 |
4,205 |
5,027 |
(9.9) |
(3.4) |
5,576 |
2,159 |
78.4 |
71.8 |
1,210 |
| Economic capital allocated |
2,390 |
9.4 |
5.9 |
2,185 |
2,313 |
1,943 |
19.2 |
18.5 |
1,631 |
446 |
(19.4) |
(27.6) |
554 |
(1) At constant exchange rate.
BBVA footprint in South America 31-12-2010
|
Banks |
Pension fund managers |
Insurance companies |
| Argentina |
x |
|
x |
| Bolivia |
|
x |
|
| Chile |
x |
x |
x |
| Colombia |
x |
x |
x |
| Ecuador |
|
x |
|
| Panama |
x |
|
|
| Paraguay |
x |
|
|
| Peru |
x |
x |
|
| Uruguay |
x |
|
|
| Venezuela |
x |
|
x |
Relevant business indicators
(Million euros and percentages)
Download
| |
South America |
| |
31-12-10 |
D% |
D% (1) |
31-12-09 |
31-12-08 |
| Total lending to customers (gross) |
31,512 |
20.2 |
21.5 |
26,223 |
25,260 |
| Customer deposits (2) |
36,070 |
14.4 |
20.7 |
31,528 |
29,374 |
| Off-balance sheet funds |
51,862 |
33.9 |
16.2 |
38,720 |
25,831 |
| . Mutual funds |
3,063 |
17.0 |
4.0 |
2,617 |
1,300 |
| . Pension funds |
48,800 |
35.2 |
17.1 |
36,104 |
24,531 |
| Efficiency ratio (%) |
43.9 |
|
|
43.4 |
44.5 |
| NPA ratio (%) |
2.5 |
|
|
2.7 |
2.1 |
| Coverage ratio (%) |
130 |
|
|
129 |
149 |
(1) At constant exchange rate.
(2) Including debt certificates.
28: South America. Key activity data
(Million euros at constant exchange rate)
29: South America. Efficiency
30: South America. Evolution of branch network and ATMs
31: South America. Operating income
(Million euros at constant exchange rate)
32: South America. NPA and coverage ratio
(Percentage)
33: South America. Net attributable profit
(Million euros at constant exchange rate)