This area handles the financial and non-financial needs of private individual customers (Retail Network), including the higher net-worth market segment (BBVA Banca Privada, private banking). It also manages business with SMEs, large corporations and public and private institutions through the Corporate and Business Banking unit (CBB).
Other specialized units handle online banking, consumer finance (the Consumer Finance Unit), the bancassurance business (BBVA Seguros) and BBVA Portugal.
In 2010, household finance in the Spanish market was once again stagnant, particularly consumption (–11.9% as of 31-Dec-2010), while residential mortgage lending was up 0.8% year-on-year. Furthermore, the demand for savings products was concentrated in stable remunerated deposits and in other conservative investment modalities. In this regard, time deposits, for both individuals and companies, increased 8.4% to the detriment of the current and savings accounts, which closed 2010 at practically the same level as in 2009. Finally, assets in mutual funds managed by banks and savings banks fell by 16.8%, with a negative volume effect in the year of €23,612m.
In the difficult economic background, the outcome of the Aprovecha tu Banco (Take Advantage of your Bank) campaign, in the framework of Plan Uno (see section on Strategy) has increased the market share in primary asset products and funds under management in the area. Thus, Spain and Portugal consolidated a market share gain in mortgage lending to households of 33 basis points since December 31, 2009, and reached 13.1% as of December 31, 2010. In the same way, the selective growth of the corporate segment according to the risk profile has also not prevented BBVA from continuing to be the main supplier in this segment, and it is one of the most active institutions in the placement of ICO funds, with a market share of 11.0% as of December 31, 2010, making it one of the leading players in the market. Current and savings accounts already make up 37.9% of the on-balancesheet funds and 47% of customer deposits (45% in the market) thanks to the boost given to household demand by the new products launched, including Cuenta Uno and the entire range of transactional services included in the Ventajas Uno scheme. It is important to note the improvement in the area’s positioning in household and corporate time deposits, with a market share as of 31-Dec-2010 at an all-time high of 8.7%.
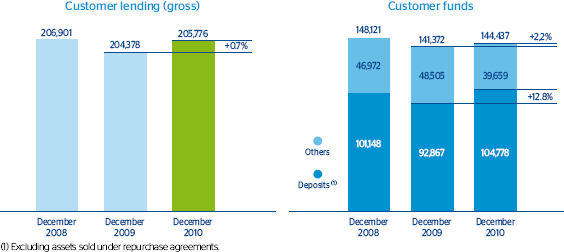
Gross customer lending was €205,776m as of December 31, 2010, a year-on-year increase of 0.7%. Mortgage lending in the household segment is growing at a sustained pace (4.0%).
At the same time, exposure to sectors and products of greater risk has declined. Customer funds grew 2.2% to €144,437m. Of them, 72.5% are on-balance customer deposits which have attracted more than €12,000m in the year, with a high level of stability and a cost that is lower than the market average (in terms of stock of deposits, at 0.8% in BBVA and 1.4% in the sector). Assets under management in mutual funds reached €21,455m, compared with €29,898m as of December 31, 2009. The decrease is due to the increasing demand of savers of other products, such as time deposits and also to the falls in stock markets. However, the main decreases have been in the assets under management with lowest added value, such as short-term fixed-income and money market funds, long-term fixed-income and those that do not involve active management. BBVA maintains its leading position in pension funds, with a market share of 18.3% as of December 31, 2010.
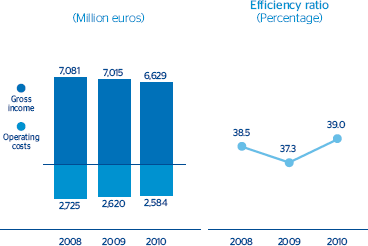
The competitive advantages of the area in its commercial products have contributed to a net interest income in 2010 of €4,675m, 4.8% down on the figure for 2009, and a yield measured as net interest income over average total assets of 2.15%. Income from fees fell year-on-year by 6.4% to €1,388m, due to reductions applied to a growing number of customers, whose loyalty has increased, and the fall mentioned above in mutual funds. Net trading income, at €198m, together with other income items of €368m, fell slightly compared to the same period in 2009. As a result, gross income stood at €6,629m (€7,015m in 2009).
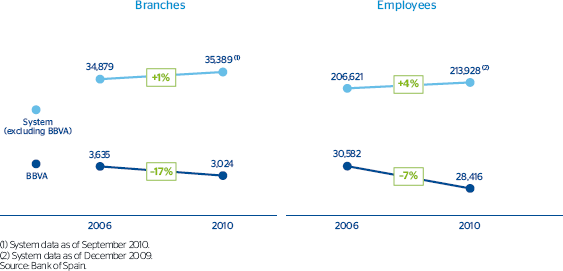
The area continues to keep operating expenses well in check, at €2,584m, which implies a new year-on-year reduction of 1.4%. This was thanks to the continuous efforts in cost management, even after the end of the Transformation Plan implemented in 2006, with which BBVA is ahead the rest of the sector. In the last twelve months, the area has reduced its number of branches by 31. It is worth noting that it has already been implemented practically all of the Transformation Plan, while the sector as a whole has only recently begun a process of consolidation that will probably include the closure of branches and staff reductions. The market share of the BBVA branch network has steadily declined to reach 7.9% as of September 30, 2010 (latest available data), although this trend is expected to be reversed once the rest of the sector starts restructuring its network.
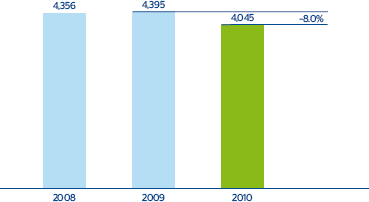
This again explains BBVA’s competitive advantage in efficiency with respect to the system as a whole, with an efficiency ratio of 39.0% and an operating income of €4,045m (€4,395m as of December 31, 2009). This gives a clear indication of its resilience and capacity to generate recurrent earnings in the current difficult economic situation.
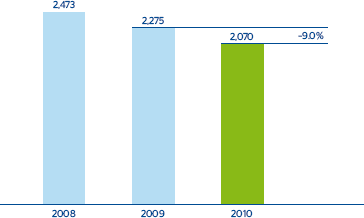
In 2010, €233m have been generated in gains from the sale-and-leaseback of commercial offices in Spain. A similar amount was allocated for generic provisions for non-performing assets. As a result, the net attributable profit amounted to €2,070m (€2,275m in 2009) and continues at a very stable level.
Finally, strict risk control has led to a reduction in the year in the NPA ratio of 10 basis points to 5.0% as of December 31, 2010, against a backdrop in which there have been signs of an upturn in this ratio in the system as a whole. The NPA ratio of banks and savings banks closed the year at 5.7%, 64 basis points up on December 31, 2009 and 70 basis points above the figure for the area.