The main aspects of the BBVA Group balance sheet and business in 2010 are:
- The loan book varied in the geographical areas where BBVA operates. Thus, in Spain and Portugal its performance was positive, with a year-on-year growth of 0.7%, in a context of a general credit slump. In contrast, Mexico and South America have been extremely buoyant, with very positive rates of growth over the year (+10.2% and +21.5% respectively). In the United States, the fall has been the result of the gradual change in the portfolio mix towards lines with lower associated risk.
- Positive performance in residential mortgages in practically all the geographical areas and in loans to major corporations and companies in the Americas.
- Customer deposits performed strongly, due to the increase in time deposits in the domestic sector and low-cost funds in the non-domestic sector. In both cases, the most notable aspect is the effort to strengthen customer loyalty.
- The leading position in pension funds in Spain and most of the Americas has been maintained.
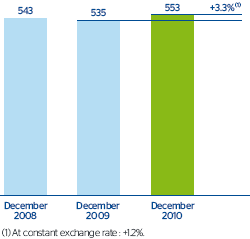
- Continuing stability in the Group’s balance sheet. Total assets at the end of December were similar to the figure for 31-Dec-2009 (+3.3% or +1.2% at constant exchange rates). In addition, the Bank’s balance sheet is characterized by great strength in the indicators of risk, solvency and liquidity and its adequate financing structure. To date, the Group meets all the requirements set by regulations in this respect.
- The main items in assets and liabilities are well known to the Group, as they have been generated by the Bank itself from the portfolios of its customers, about whom it has detailed information based on long-term relationships.
- Positive effect of the exchange rate, since the currencies with the greatest impact on the Bank’s balance sheet and activity have appreciated, except for the Venezuelan bolivar, owing to the devaluation in January 2010. We have included rates of change at constant exchange rates for the most important data in order to help the analysis of the business activity.
The main item on the asset side of the balance sheet is lending to customers, which represented 61.3% of total assets as of December 31, 2010, compared with 60.4% a year earlier. On the liabilities side, customer deposits also increased to 49.9% of the total balance sheet at the close of 2010, compared with 47.5% as of 31-Dec-2009, and thus the deposit-to-loan ratio increased to 81.4% (78.6% in December 2009).
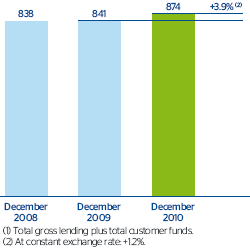
The Group’s business volume that as mentioned above came to €874 billion as of December 31, 2010, showed a year-on-year increase of 3.9% compared to the €841 billion as of the same date last year. Of this figure, €348 billion corresponded to gross lending and €526 billion to total customer funds, which includes both on-balance sheet and mutual and pension funds and customer portfolios.