This area encompasses the Group’s business in the United States and in the Commonwealth of Puerto Rico. It also incorporates the assets and liabilities of BBVA’s office in New York, which garners the activity carried out with large corporations and businesses in New York and the business of markets and distribution in the same area.
The economic surge in the United States at the end of 2009 lost steam at the start of 2010, although growth continued and ended at 3% for the year as a whole. Even so, the recovery is limited, as is explained in the section “The Economic Background,” for three reasons: the slowdown in the real estate market; the weakness in employment; and the deleveraging process in which households are still involved.
Inflation in 2010 continued in check, as forecast, while interest rates are expected to remain at exceptionally low levels as long as the economic situation does not improve significantly.
Finally, the exchange rate of the dollar against the euro has continued to appreciate. Final exchange rates were up 7.8% in the last twelve months, closing on 31-Dec-2010 at $1.34/euro. Average rates appreciated by 5.2% to $1.33/euro. Overall, this has had a positive effect on area’s financial statements and business over the year. As is normally the case, the figures below are given at constant exchange rates, unless indicated otherwise, and both scenarios can be seen in the adjoining tables.
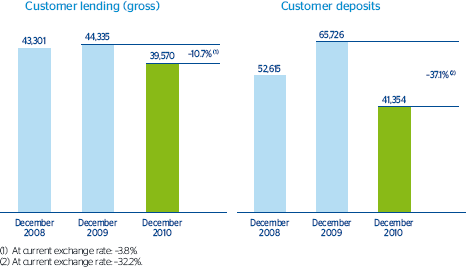
In this situation, the rate at which BBVA USA’s loan book was shrinking slowed considerably in the final months of 2010. In the last quarter the fall was only 1.8% (–3.1% in the previous quarter), and over the year as a whole the drop was 10.7% to €39,570m. However, it is worth highlighting the selective growth of lending in the area, with a change in the portfolio mix towards items of less cyclical risk resulting from a clear focus on customer loyalty, credit quality, promotion of crossselling and customer profitability. Thus the residential real estate portfolio increased by 28.6% over the year, while commercial, industrial and corporate loans were up 10.7%. In contrast, the construction real estate portfolio has fallen by 40.7%.
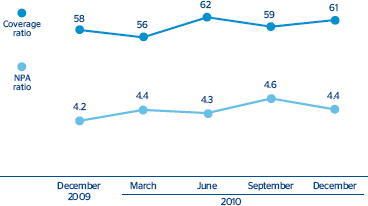
In addition, adequate risk control in 2010 and the proactive measures taken in the fourth quarter of 2009, consisting of additional loan-loss provisioning to increase the coverage ratio in the area, have led to better asset quality. As a result, the NPA ratio ended the year at 4.4% (4.2% as of 31-Dec-2009) and the coverage ratio was up to 61% (58% 12 months earlier).
Customer deposits also decreased over the year as a whole by 37.1% to €41,354m. However, it is important to highlight the excellent performance of lower-cost deposits, which were up 7.7%, in detriment to term deposits, which were down by 20.7% in the same period.
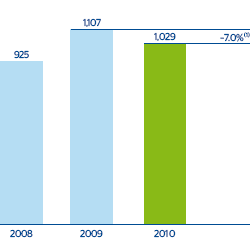
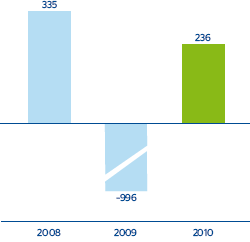
The area’s net attributable profit was €236m. It is worth noting that in 2009 the profit was affected by various one-off costs. First, loan-loss provisions made to increase the coverage ratio in the area; and second, deterioration of goodwill generated in the successive acquisitions made to construct the United States franchise. If these two items are excluded, the net attributable profit in 2010 still registers an increase of 116.8% compared with the figure excluding one-offs in 2009.
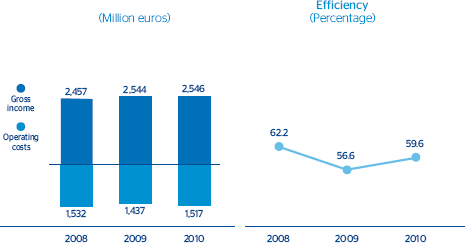
This increased profit is the result partly of the strength of the gross income, which ended the year at €2,546m (up 0.1% using constant-exchange rates and 5.5% excluding the exchange-rate effect), thanks to the contribution of Guaranty and the repricing effort made. Another positive effect is from the reduction of impairment losses on financial assets as a result of the change in the loan portfolio mix to lower-risk items (excluding last-year’s one-offs, this item fell by 24.6%). Finally, the lack of additional charges such as the deterioration in goodwill in 2009 also had a positive impact.