


Spain
Highlights for the period January - June 2026
- Lending dynamism continues
- Favorable performance of recurring revenues
- NPL ratio at historical lows
- Quarterly net attributable profit remains above €1 billion
BUSINESS ACTIVITY (1)
(VARIATION COMPARED TO 31-12-25)
(1) Excluding repos.
NET INTEREST INCOME / AVERAGE TOTAL ASSETS
(PERCENTAGE)
OPERATING INCOME (MILLIONS OF EUROS)
NET ATTRIBUTABLE PROFIT (LOSS) (MILLIONS OF EUROS)
| FINANCIAL STATEMENTS AND RELEVANT BUSINESS INDICATORS (MILLIONS OF EUROS AND PERCENTAGE) | |||
|---|---|---|---|
| Income statement | 6M26 | 𝚫 % | 6M25 (1) |
| Net interest income | 3,346 | 4.1 | 3,215 |
| Net fees and commissions | 1,194 | 2.2 | 1,168 |
| Net trading income | 416 | 4.8 | 397 |
| Other operating income and expenses | 191 | (8.7) | 209 |
| Of which: Insurance activities | 212 | 5.4 | 201 |
| Gross income | 5,147 | 3.1 | 4,990 |
| Operating expenses | (1,729) | 10.3 | (1,568) |
| Personnel expenses | (956) | 10.0 | (869) |
| Other administrative expenses | (569) | 11.0 | (512) |
| Depreciation | (205) | 9.2 | (187) |
| Operating income | 3,417 | (0.1) | 3,422 |
| Impairment on financial assets not measured at fair value through profit or loss | (300) | (0.3) | (301) |
| Provisions or reversal of provisions and other results | (37) | (8.5) | (40) |
| Profit (loss) before tax | 3,080 | — | 3,080 |
| Income tax | (907) | (5.1) | (955) |
| Profit (loss) for the period | 2,174 | 2.3 | 2,125 |
| Non-controlling interests | (2) | 7.9 | (1) |
| Net attributable profit (loss) | 2,172 | 2.3 | 2,124 |
| Balance sheets | 30-06-26 | 𝚫 % | 31-12-25 (1) |
| Cash, cash balances at central banks and other demand deposits | 18,023 | (9.6) | 19,929 |
| Financial assets designated at fair value | 150,010 | 25.1 | 119,910 |
| Of which: Loans and advances | 63,824 | 47.2 | 43,346 |
| Financial assets at amortized cost | 276,183 | 4.8 | 263,437 |
| Of which: Loans and advances to customers | 201,279 | 4.3 | 192,959 |
| Inter-area positions | 75,402 | 56.2 | 48,288 |
| Tangible assets | 2,667 | (1.9) | 2,718 |
| Other assets | 3,427 | (10.0) | 3,808 |
| Total assets/liabilities and equity | 525,713 | 14.8 | 458,090 |
| Financial liabilities held for trading and designated at fair value through profit or loss | 109,735 | 32.6 | 82,785 |
| Deposits from central banks and credit institutions | 41,334 | 19.5 | 34,582 |
| Deposits from customers | 260,326 | 3.5 | 251,430 |
| Debt certificates | 75,476 | 41.6 | 53,300 |
| Inter-area positions | — | — | — |
| Other liabilities | 23,272 | 11.8 | 20,822 |
| Allocated regulatory capital | 15,570 | 2.6 | 15,171 |
| Relevant business indicators | 30-06-26 | 𝚫 % | 31-12-25 |
| Performing loans and advances to customers under management (2) | 199,557 | 4.5 | 190,943 |
| Non-performing loans | 6,595 | (2.4) | 6,759 |
| Customer deposits under management (1)(2) | 240,476 | 0.9 | 238,447 |
| Off-balance sheet funds (1)(3) | 126,530 | 5.9 | 119,535 |
| Risk-weighted assets (1) | 120,207 | 0.4 | 119,734 |
| RORWA (4) | 3.7 | 3.4 | |
| Efficiency ratio (%) | 33.6 | 33.3 | |
| NPL ratio (%) | 2.9 | 3.0 | |
| NPL coverage ratio (%) | 71 | 67 | |
| Cost of risk (%) | 0.31 | 0.34 | |
| (1) Revised balances. For more information, please refer to the “Business Areas” section. (2) Excluding repos. (3) Includes mutual funds, customer portfolios and pension funds. (4) For more information on the calculation methodology, as well as the calculation of the metric at the consolidated Group level, see Alternative Performance Measures at this report. |
|||
Macro and industry trends
The dynamism of economic activity has continued during the first quarter of 2026 and growth expectations going forward remain favorable. The advance in employment and private consumption, the recovery in residential investment and the resilience of service exports are expected to continue to act as factors supporting activity, offsetting the effects of higher energy costs, lower growth in the Eurozone and the more restrictive tone of monetary policy. All in all, BBVA Research leaves its growth forecast for the full year unchanged at 2.4%, the same advance anticipated in the previous scenario.
For its part, the increase in fuel prices, although contained by fiscal support measures, has placed June inflation at 3.2%, the same level as in the previous two months. Even if energy prices gradually normalize and no significant second-round effects appear, the headline rate is expected to remain high during the second half of the year and close the year at 4.3%. Average inflation in 2026 could reach 3.8%, nine tenths above what was forecast a quarter ago.
As for the banking system, with data at the end of May 2026, the volume of credit to the private sector grew by 3.3% year-on-year (4.2% excluding the consumer credit portfolio for other purposes, which underwent a methodological change in April 2026 by the Bank of Spain), with higher growth in the portfolios of credit to households at 2.9% (+5.4% excluding the change) than in credit to non-financial companies (+3.8%). Non-financial sector deposits grew by 5.5% year-on-year in May 2026, due to a 3.7% increase in time deposits, and 5.9% in demand deposits. The NPL ratio stood at 2.63% in April 2026, 55 basis points lower than in May the previous year. Additionally, the system maintains comfortable levels of solvency and liquidity.
Activity
The most relevant aspects related to the area's activity during the first half of 2026 were:
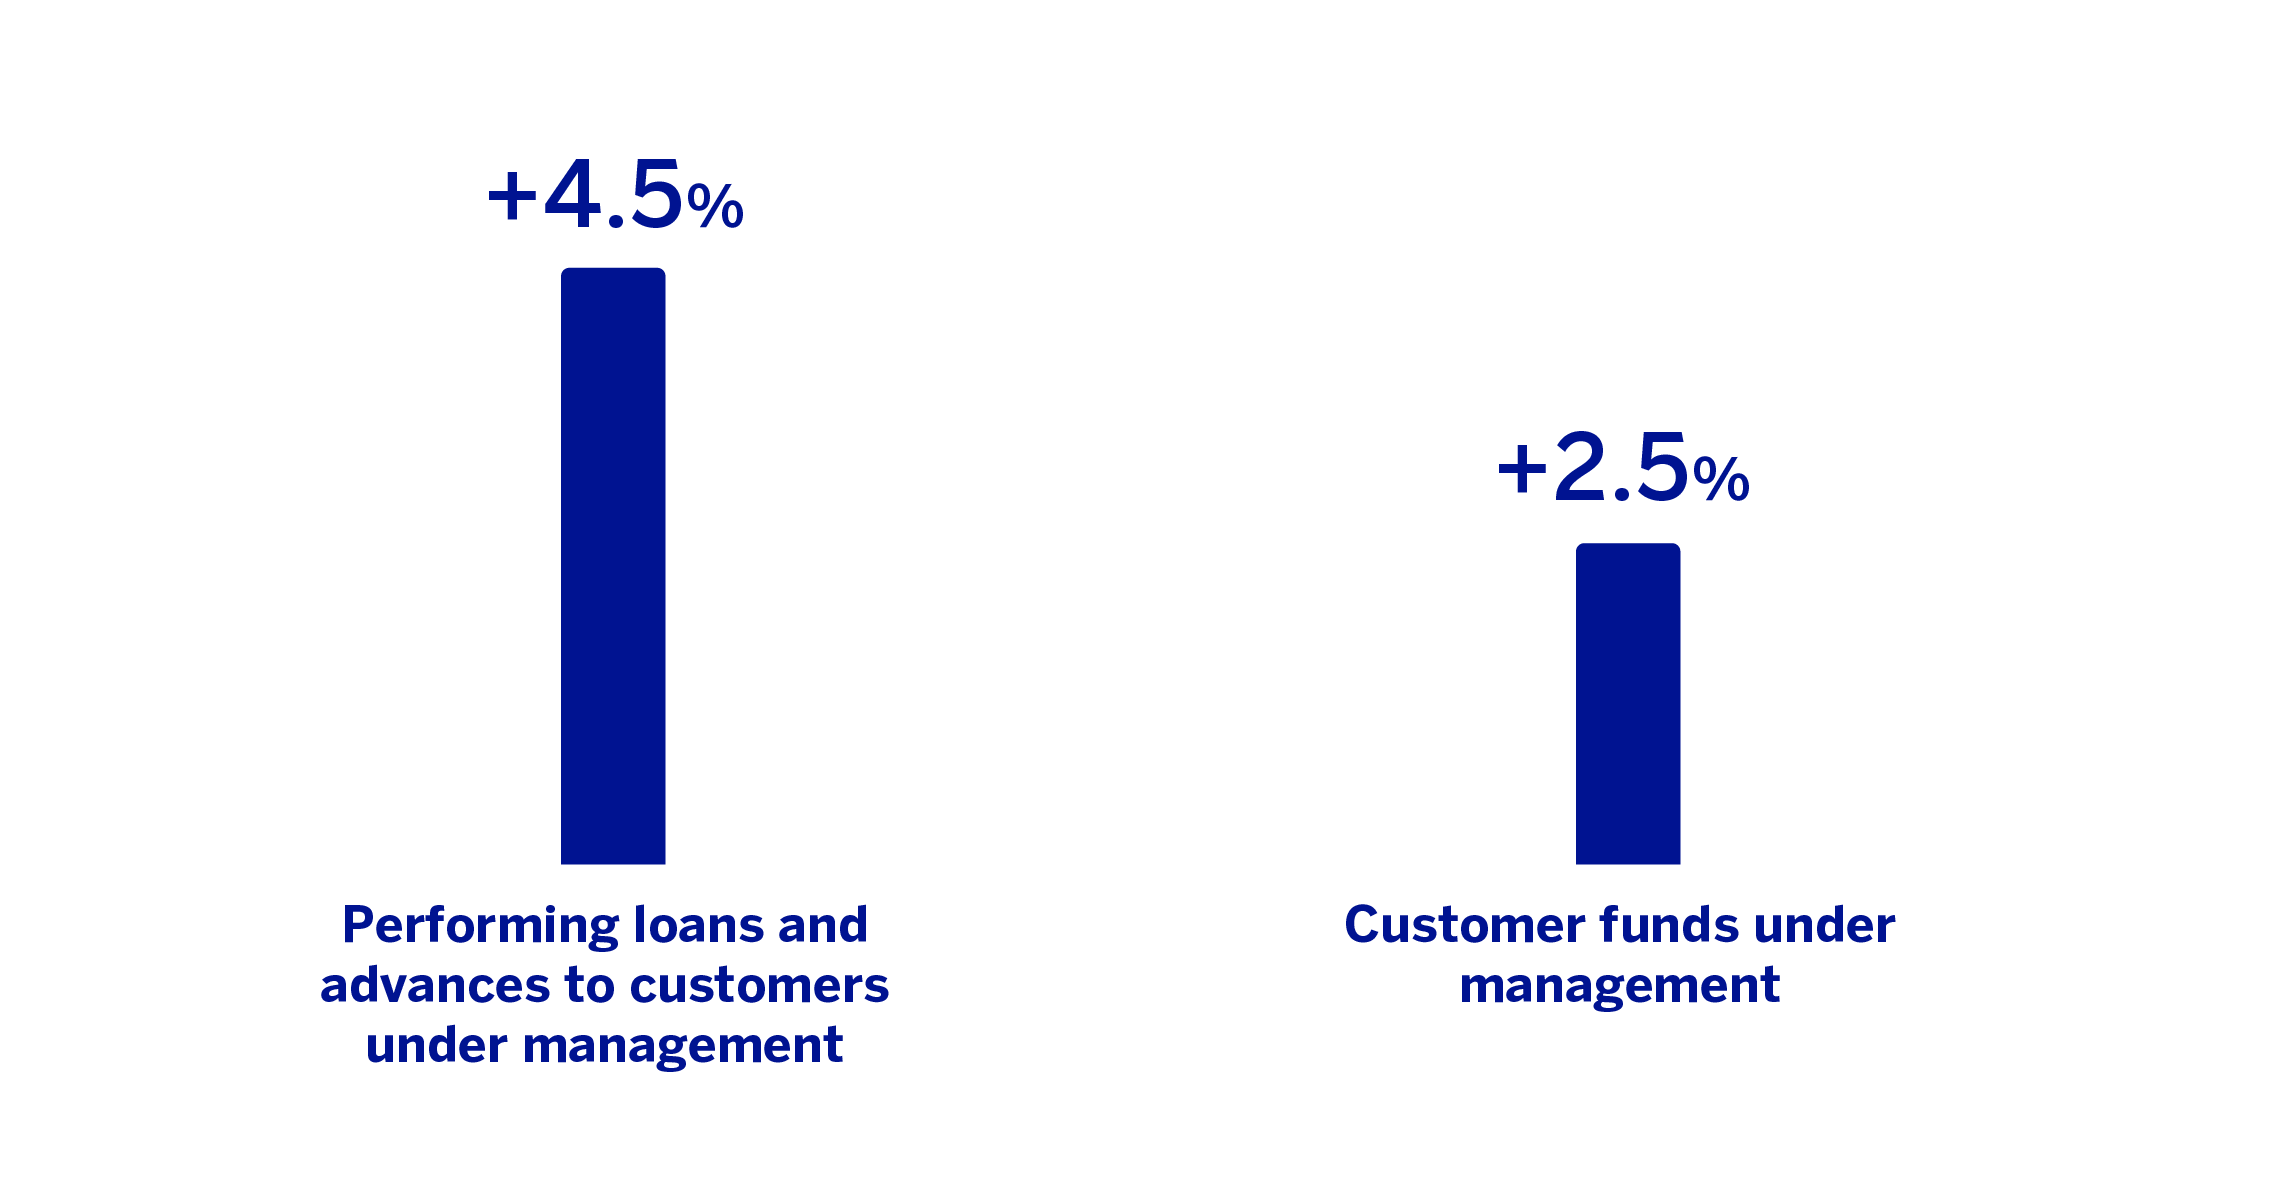
Lending balances were 4.5% higher than at the end of December 2025, mainly driven by the performance of the public sector (19.7%) and the larger corporate segments (3.9%). The dynamism of consumer credit (+5.2%) also stood out.
Total customer funds grew by 2.5%, with an increase in off-balance sheet funds (mutual and pension funds) of 5.9%, favored by the market performance and stability in customer deposits (0.9%).
The most relevant aspects related to the area's activity during the second quarter of 2026 were:
Lending activity increased by 3.3% compared to the end of March 2026, mainly driven by the seasonal increase in loans to the public sector (+19.5% due to the advance payment of the extra pension to pensioners) and by the performance of credit to companies (+2.9% larger companies and +2.2% medium-sized companies), followed by consumer lending (+2.6%).
Regarding asset quality, the NPL ratio stood at 2.9%, with a decrease of 8 basis points compared to the end of March, supported by activity growth and by the sale of a mortgage-backed portfolio. For its part, the NPL coverage ratio increased by 192 basis points in the quarter, to 71% at the end of June 2026.
Total customer funds grew by 3.9% in the second quarter of 2026, favored by the growth of the retail segment. By product, time deposits presented a growth of 5.1%, favored by the evolution of wholesale balances. For their part, demand deposits increased by 2.2%, and off-balance sheet funds have been favored by a positive market effect, presenting a growth of 6.3% compared to the end of the previous quarter.
Results
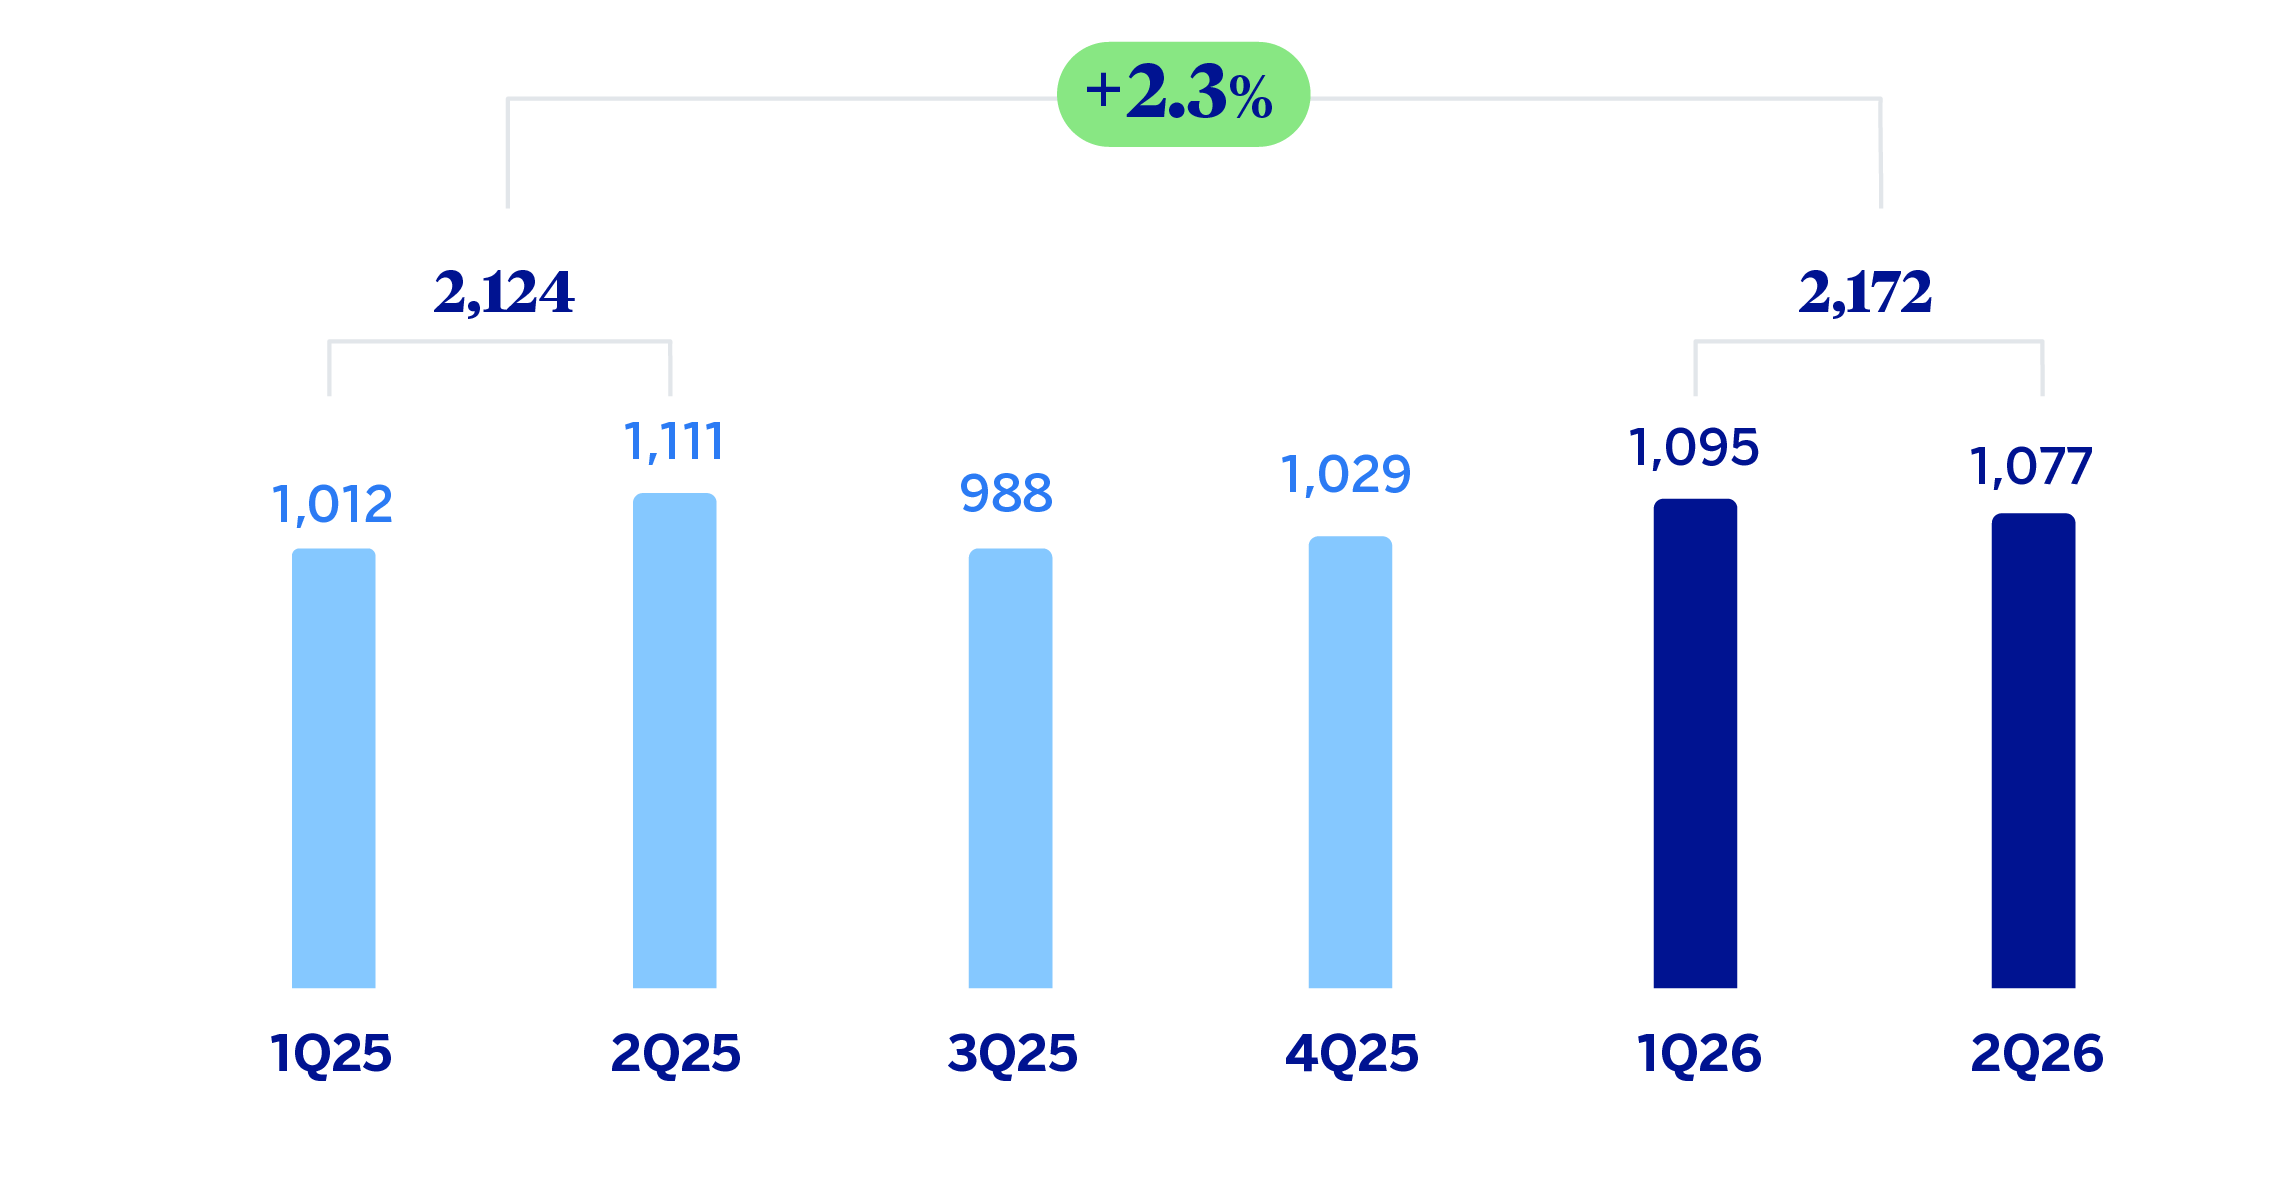
Spain generated a net attributable profit of €2,172 million in the first half of 2026, which is 2.3% above the result achieved in the same period of 2025, driven by the evolution of the net interest income, supported by the dynamism of lending activity in all customer segments , together with higher net fees and commissions and NTI.
The most relevant aspects of the year-on-year evolution of the area's income statement at the end of June 2026 were:
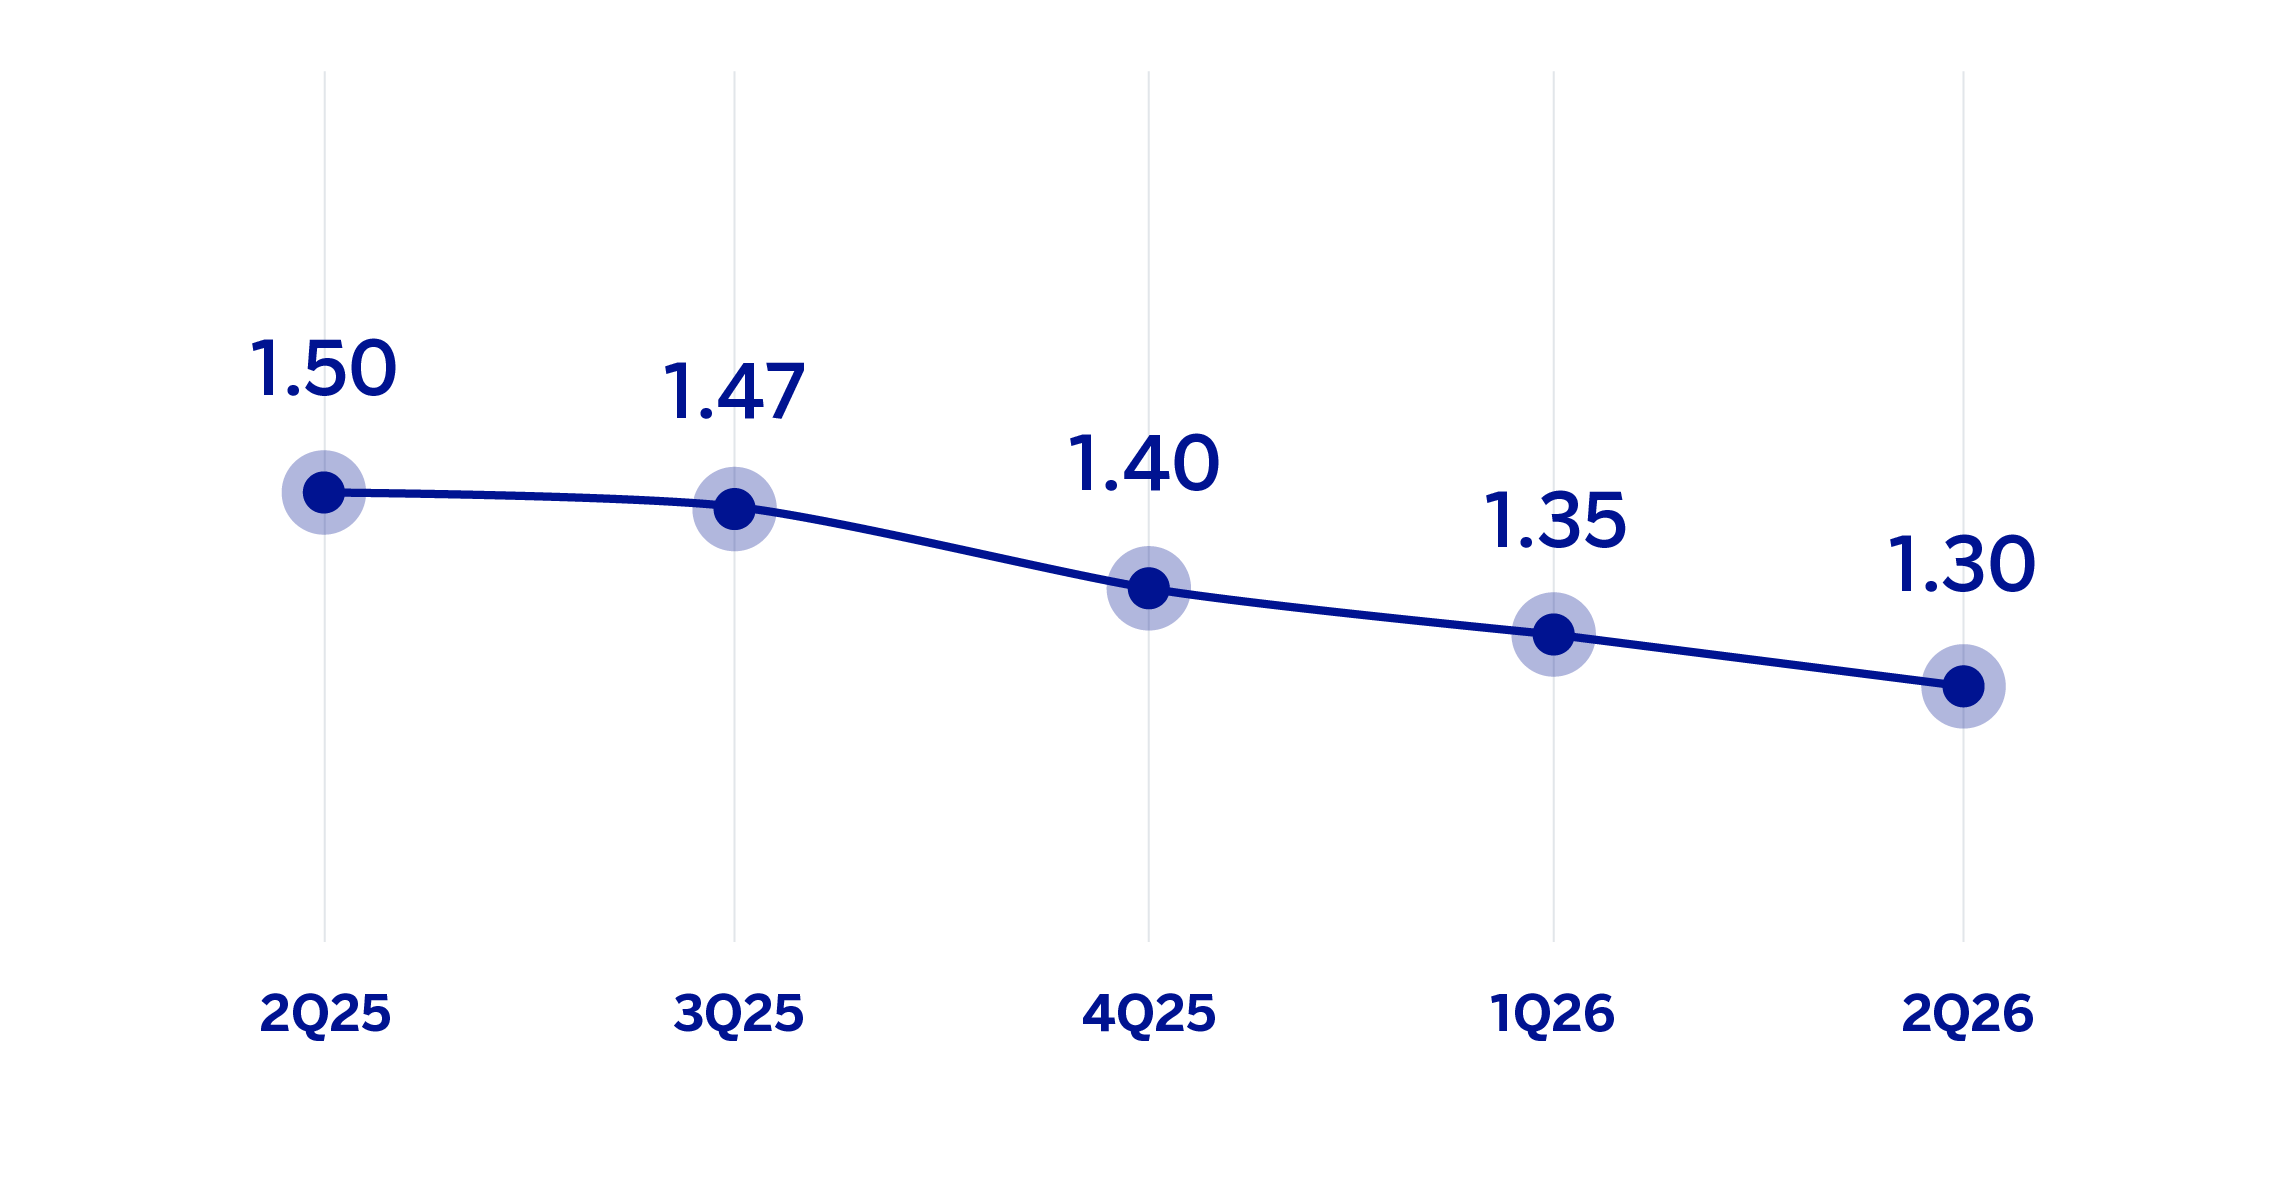
Net interest income grew by 4.1%, supported by higher lending balances and a higher contribution from the securities portfolio.
Net fees and commissions grew by 2.2% compared to the same period of the previous year, driven primarily by the performance of asset management fees and those from the relationship with wholesale customers.
Net Trading Income (NTI) showed an increase of 4.8% compared to the first half of the previous year, including higher results achieved by the Global Markets unit.
The other operating income and expenses line showed a balance of €191m, which is 8.7% lower than in the same period of the previous year, as the first half of 2025 included extraordinary income associated with the achievement of certain milestones set out in the Allianz bancassurance agreement.
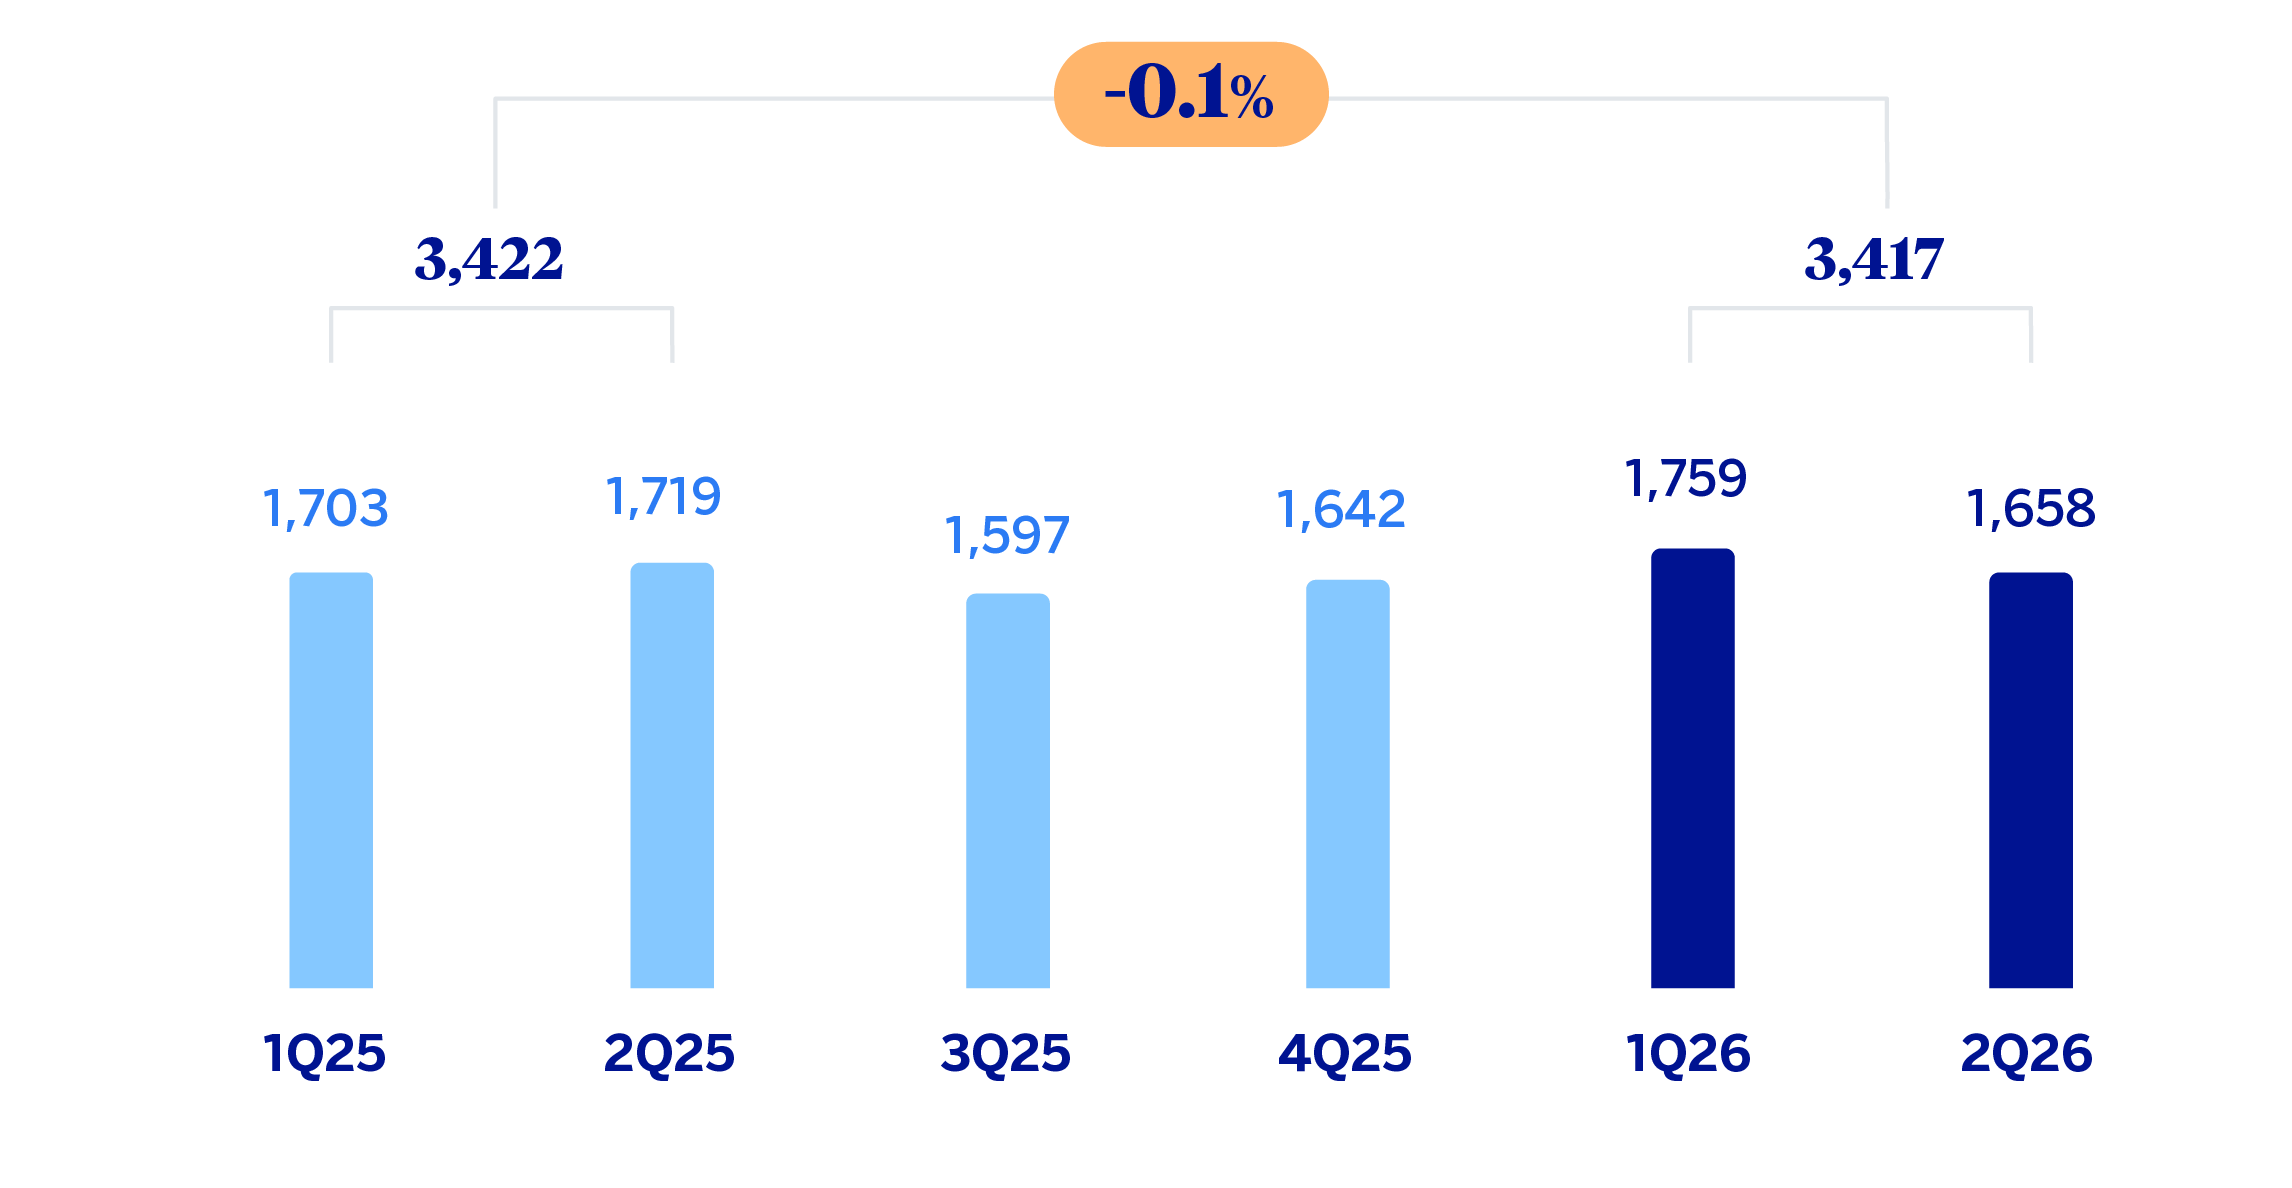
Operating expenses increased by 10.3% compared to the first half of 2025, due to both higher general expenses (mainly in technology) and personnel expenses, the latter reflecting the impact of voluntary redundancies in the first quarter of 2026. Both periods include, in the general expenses line, the impact of the upward re-estimation of the applied pro-rata on the Value Added Tax
The impairment on financial assets stood in line with the first half of the previous year (-0.3%). For its part, the cumulative cost of risk at the end of June 2026 decreased by 3 basis points compared to the previous quarter and stood at 0.31%, in line with that of the same period of the previous year.
Finally, the income tax line includes the accrual corresponding to first semester of 2026, of the tax on net interest income and net fees and commissions that have amounted to approximately €149 million, in line with the €150 million accrued in the same period of the previous year.
The net attributable profit generated by Spain in the second quarter of 2026 reached €1,077m, which represents a decrease of 1.6% compared to the previous quarter, mainly due to a decrease in NTI, where the first quarter of the year was favored by the performance of the insurance portfolio and portfolio sales. Additionally, the evolution of the quarter's result is explained by the good performance of the net interest income together with lower operating expenses (the previous quarter incorporated voluntary redundancies) and provisions for impairment on financial assets, mainly as a result of the aforementioned portfolio sale.
Read legal disclaimer of this report.