


Group
Quarterly evolution of results
In the second quarter of 2026, the Group achieved a net attributable profit of €3,062 million, which represents an increase of 2.4% compared to the previous quarter, mainly driven by the growth of recurring revenues, lower operating expenses and a lower level of loan-loss provisions.
| CONSOLIDATED INCOME STATEMENT: QUARTERLY EVOLUTION (MILLIONS OF EUROS) | |||||||
|---|---|---|---|---|---|---|---|
| 2026 | 2025 |
||||||
| 2Q | 1Q | 4Q | 3Q | 2Q | 1Q | ||
| Net interest income | 7,627 | 7,537 | 7,034 | 6,640 | 6,208 | 6,398 | |
| Net fees and commissions | 2,316 | 2,256 | 2,145 | 2,060 | 1,951 | 2,060 | |
| Net trading income | 582 | 915 | 694 | 531 | 484 | 948 | |
| Other operating income and expenses | (19) | (56) | (78) | (128) | 67 | (82) | |
| Gross income | 10,506 | 10,652 | 9,795 | 9,102 | 8,710 | 9,324 | |
| Operating expenses | (3,951) | (4,049) | (3,971) | (3,574) | (3,224) | (3,562) | |
| Personnel expenses | (2,164) | (2,201) | (2,181) | (1,899) | (1,792) | (1,901) | |
| Other administrative expenses | (1,371) | (1,430) | (1,398) | (1,296) | (1,062) | (1,283) | |
| Depreciation | (416) | (418) | (393) | (379) | (370) | (378) | |
| Operating income | 6,555 | 6,604 | 5,823 | 5,528 | 5,485 | 5,762 | |
| Impairment on financial assets not measured at fair value through profit or loss | (1,677) | (1,820) | (1,745) | (1,567) | (1,377) | (1,385) | |
| Provisions or reversal of provisions | (31) | (64) | (140) | (99) | (82) | (51) | |
| Other gains (losses) | 12 | 2 | (4) | 6 | 50 | 22 | |
| Profit (loss) before tax | 4,859 | 4,722 | 3,934 | 3,868 | 4,076 | 4,348 | |
| Income tax | (1,578) | (1,534) | (1,269) | (1,206) | (1,160) | (1,466) | |
| Profit (loss) for the period | 3,281 | 3,189 | 2,665 | 2,662 | 2,916 | 2,882 | |
| Non-controlling interests | (219) | (199) | (132) | (132) | (167) | (184) | |
| Net attributable profit (loss) | 3,062 | 2,989 | 2,533 | 2,531 | 2,749 | 2,698 | |
| Adjusted earnings (loss) per share (euros) (1) | 0.54 | 0.51 | 0.43 | 0.42 | 0.46 | 0.45 | |
| Earnings (loss) per share (euros) (1) | 0.53 | 0.51 | 0.42 | 0.42 | 0.46 | 0.45 | |
| (1) For more information, see Alternative Performance Measures at this report. | |||||||
Year-on-year evolution of results
The BBVA Group achieved a cumulative result of €6,051 million at the end of the first half of 2026, representing an increase of 11.1% over the same period last year, supported by the strong performance of recurring revenues from the banking business. If the exchange rates variation is excluded, this growth stands at 10.0%.
| CONSOLIDATED INCOME STATEMENT (MILLIONS OF EUROS) | ||||
|---|---|---|---|---|
| 6M26 | 𝚫 % | 𝚫 % at constant exchange rates | 6M25 | |
| Net interest income | 15,164 | 20.3 | 18.8 | 12,607 |
| Net fees and commissions | 4,572 | 14.0 | 15.8 | 4,010 |
| Net trading income | 1,498 | 4.6 | 5.5 | 1,431 |
| Other operating income and expenses | (75) | n.s. | 140.4 | (15) |
| Gross income | 21,159 | 17.3 | 16.9 | 18,034 |
| Operating expenses | (8,000) | 17.9 | 17.9 | (6,787) |
| Personnel expenses | (4,365) | 18.2 | 18.7 | (3,693) |
| Other administrative expenses | (2,801) | 19.4 | 19.3 | (2,345) |
| Depreciation | (834) | 11.4 | 10.0 | (749) |
| Operating income | 13,159 | 17.0 | 16.2 | 11,247 |
| Impairment on financial assets not measured at fair value through profit or loss | (3,497) | 26.6 | 24.2 | (2,761) |
| Provisions or reversal of provisions | (95) | (28.4) | (28.8) | (133) |
| Other gains (losses) | 14 | (79.9) | (79.5) | 72 |
| Profit (loss) before tax | 9,581 | 13.7 | 13.5 | 8,424 |
| Income tax | (3,112) | 18.5 | 18.6 | (2,626) |
| Profit (loss) for the period | 6,469 | 11.6 | 11.2 | 5,798 |
| Non-controlling interests | (418) | 19.0 | 31.4 | (351) |
| Net attributable profit (loss) | 6,051 | 11.1 | 10.0 | 5,447 |
| Adjusted earnings (loss) per share (euros) (1) | 1.06 | 0.91 | ||
| Earnings (loss) per share (euros) (1) | 1.04 | 0.91 | ||
| (1) For more information, see Alternative Performance Measures at this report. | ||||
Unless expressly indicated otherwise, for a better understanding of the changes under the main headings of the Group's income statement, the rates of change provided below refer to constant exchange rates. When comparing two dates or periods presented in this report, the impact of changes in the exchange rates against the euro of the currencies of the countries in which BBVA operates is sometimes excluded, assuming that exchange rates remain constant. For this purpose, the average exchange rate of the currency of each geographical area of the most recent period is used for both periods, except for those countries whose economies have been considered hyperinflationary, for which the closing exchange rate of the most recent period is used.
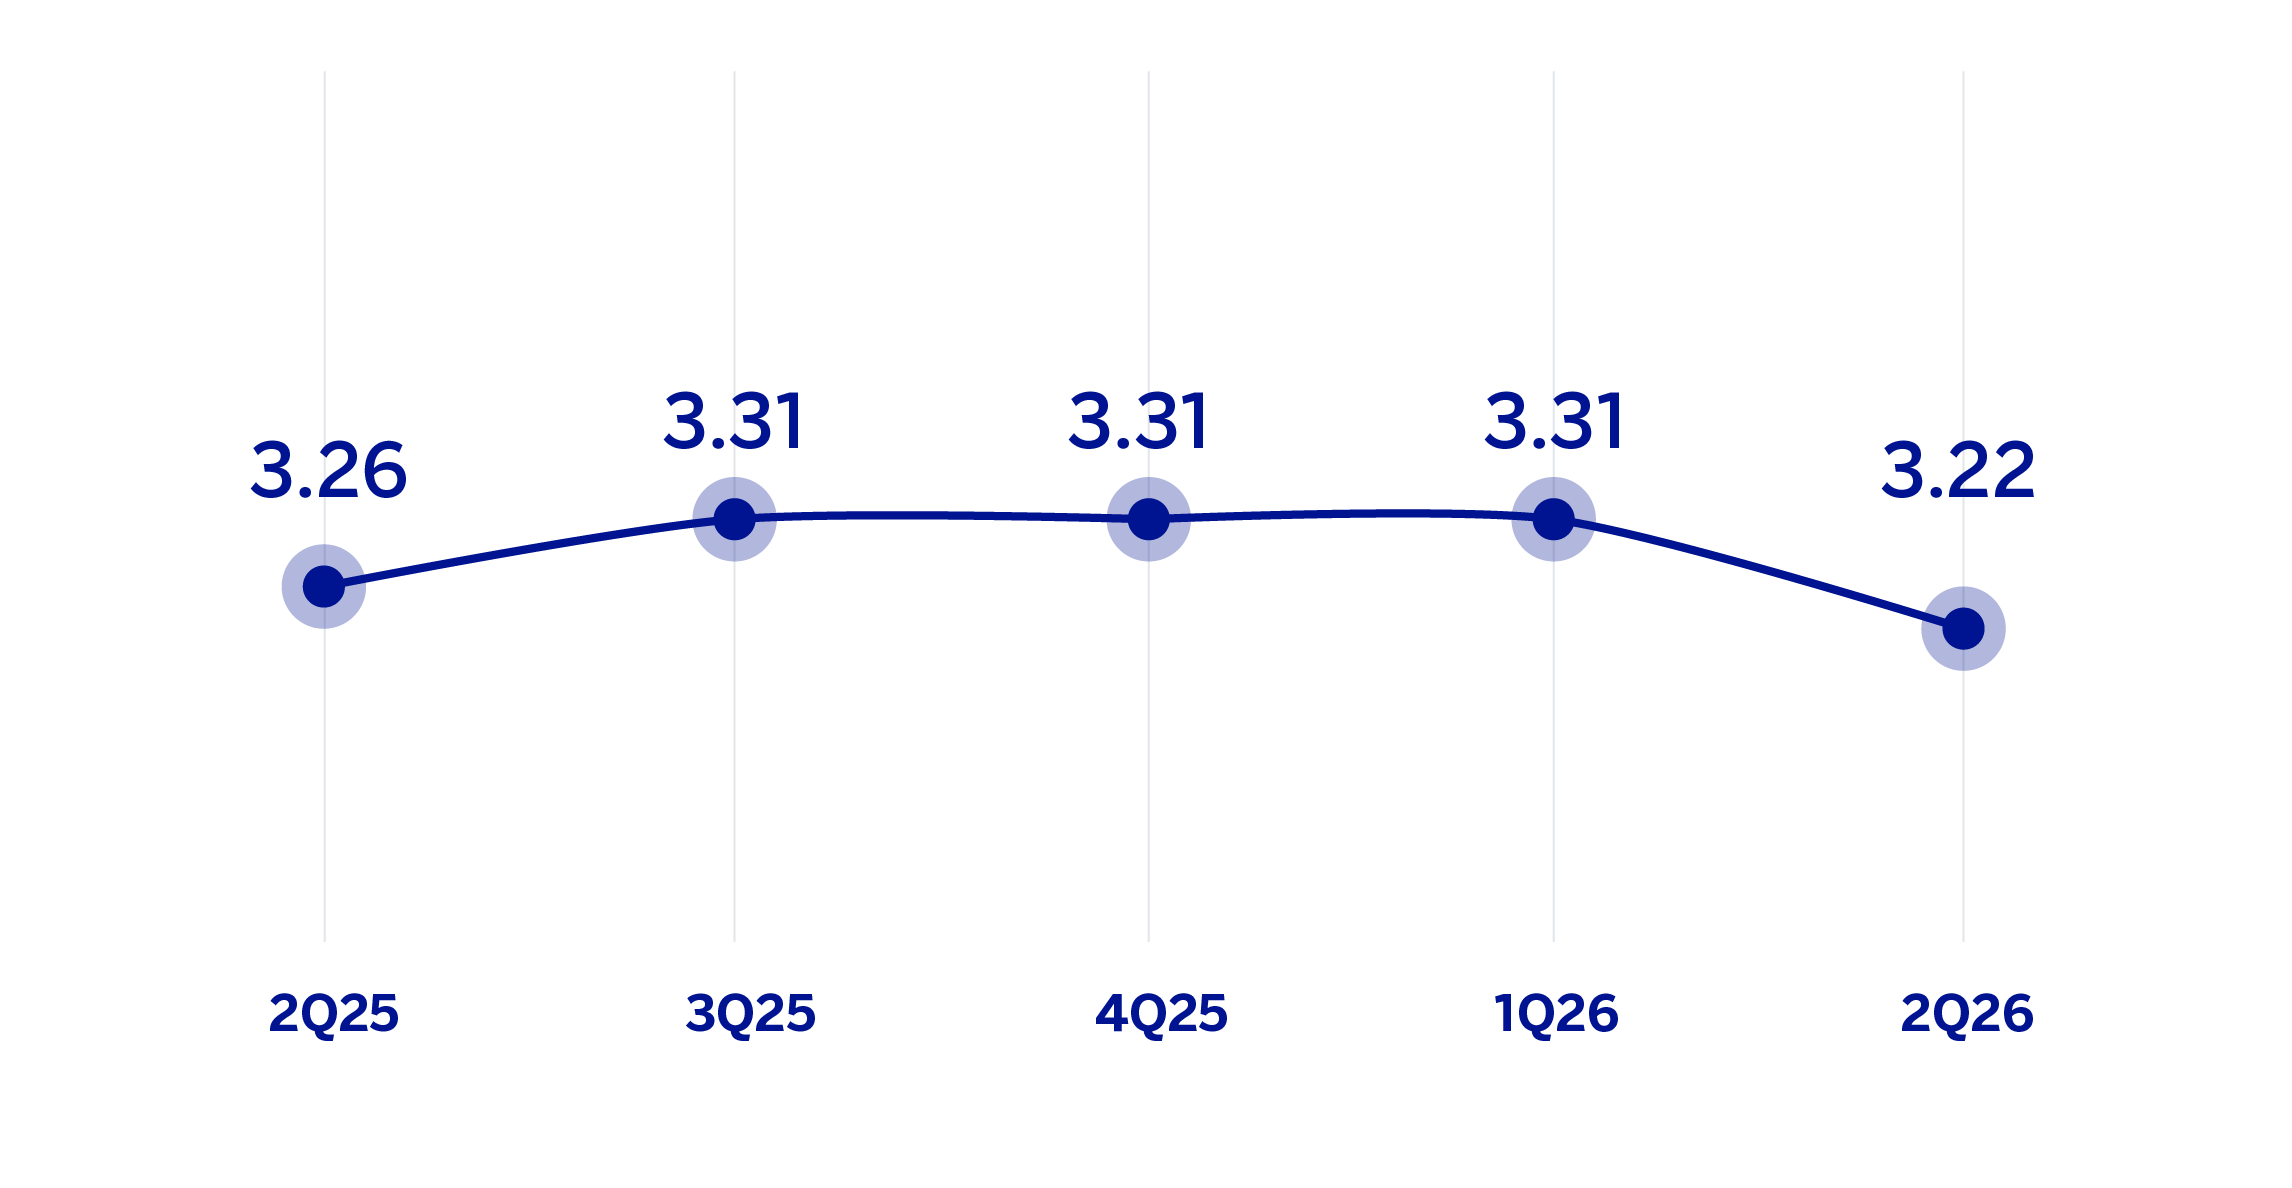
In the year-on-year evolution of the accumulated net interest income as of the end of the first half of 2026, the same positive dynamics are maintained in all business areas, although Turkey, Mexico and South America stood out. All in all, the increase in this line stood at 18.8%.
Likewise, net fees and commissions experienced a year-on-year growth of 15.8%, with a differential increase in this line in Turkey, although all areas recorded higher fees in the first half of 2026 compared to the same period of the previous year. By type, fees from payment methods stood out, and to a lesser extent, asset management fees.
As a result of this favorable evolution of the net interest income and net fees and commissions, recurring revenues from the banking business have continued to show an upward quarterly trend with a growth of 18.1% compared to the first half of 2025.
NET INTEREST INCOME / AVERAGE TOTAL ASSETS
(PERCENTAGE AT CONSTANT EXCHANGE RATES)
NET INTEREST INCOME PLUS NET FEES AND COMMISSIONS
(MILLIONS OF EUROS AT CONSTANT EXCHANGE RATES)
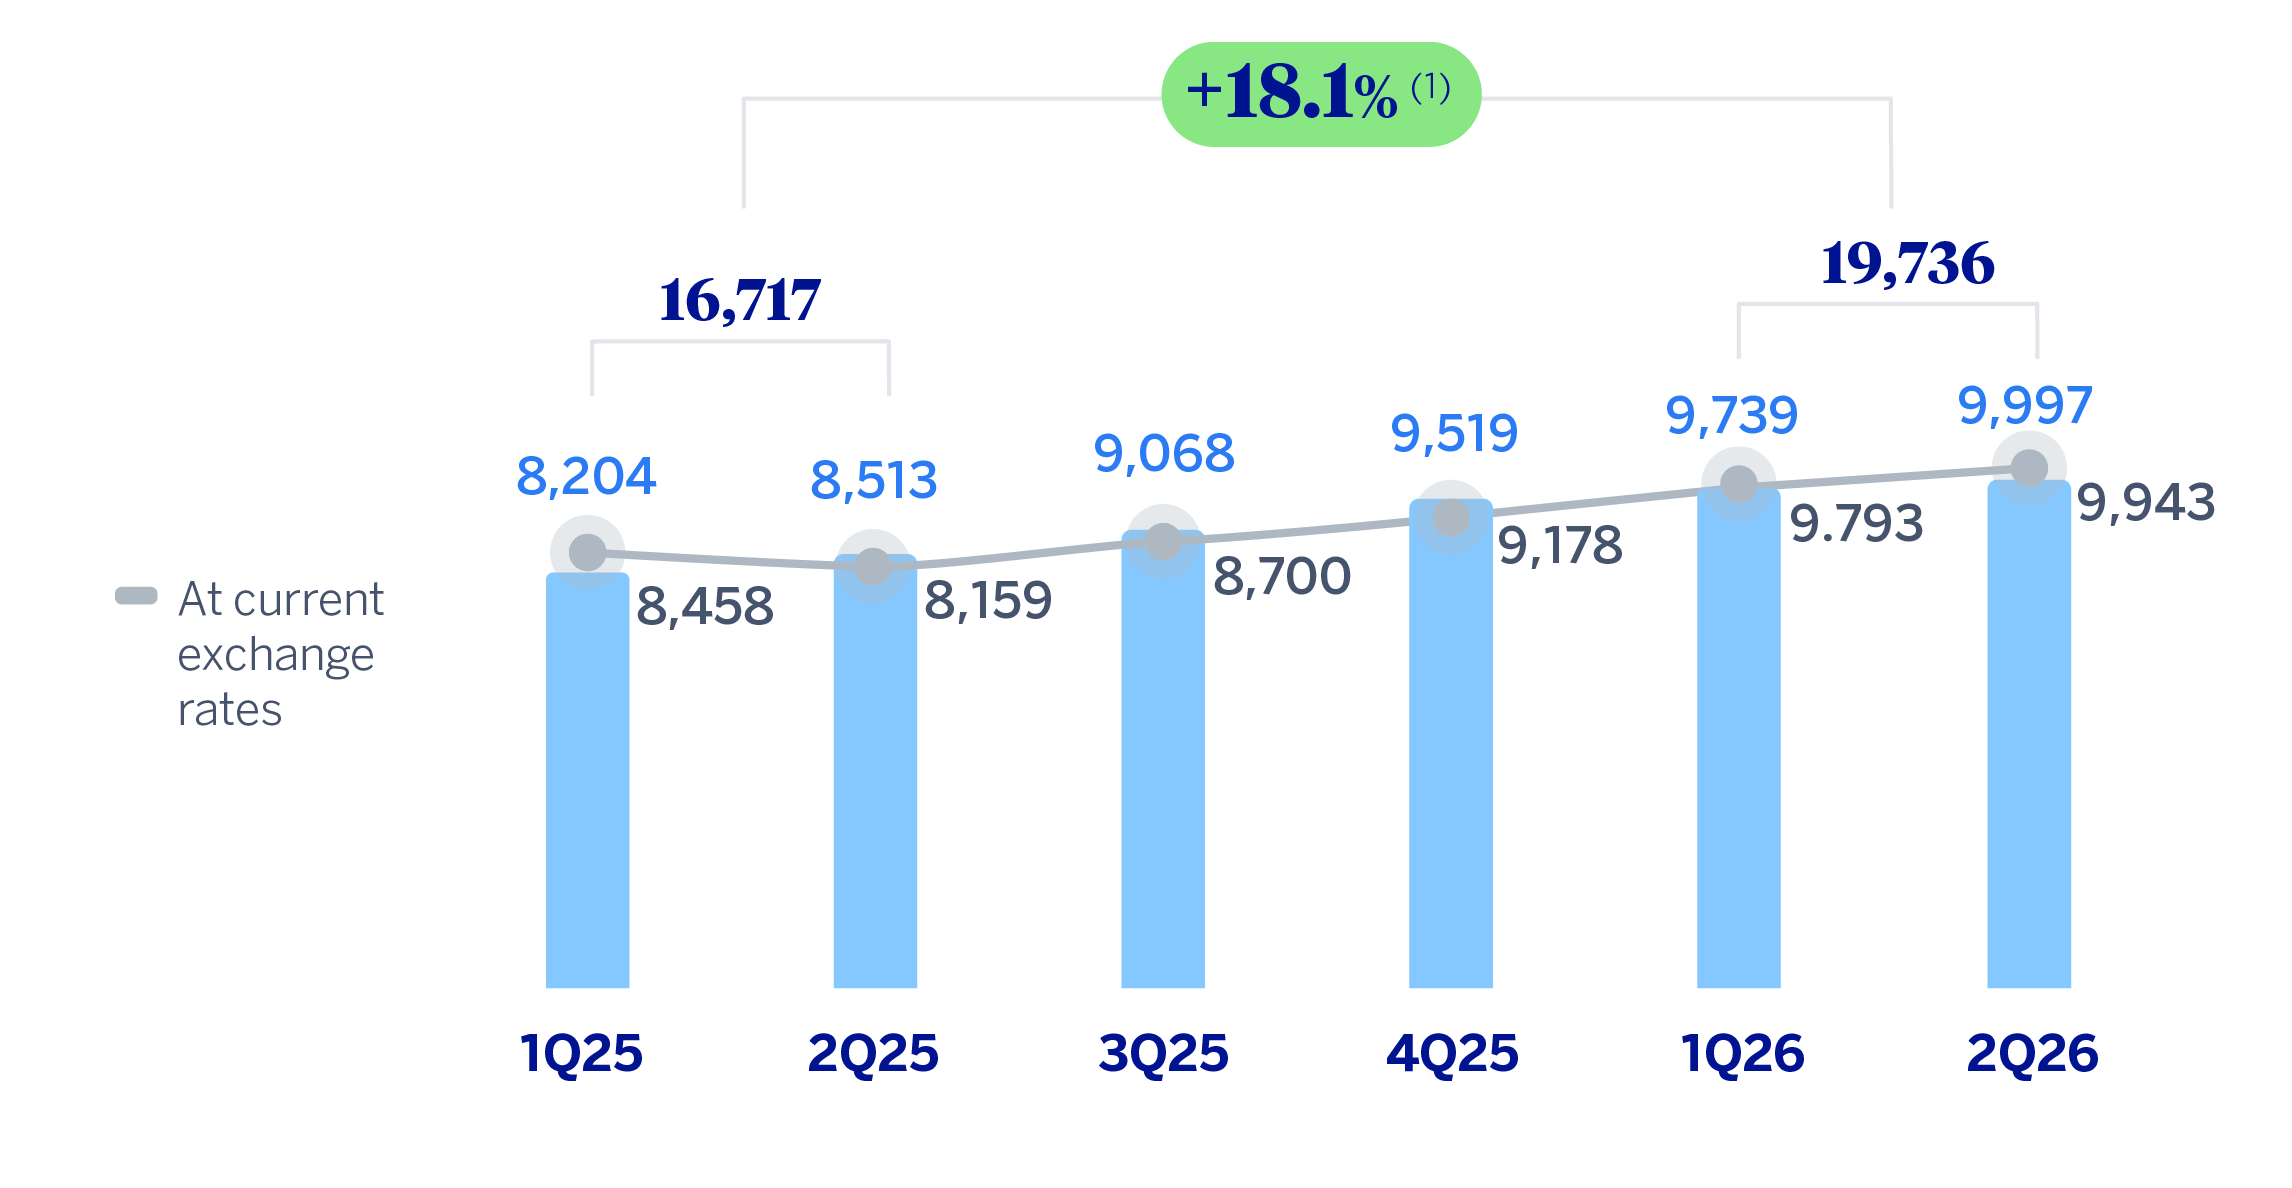
(1) At current exchange rates: +18.8%.
The NTI showed a favorable performance (+5.5% at the end of June 2026), with a positive year-on-year evolution in all business areas, and where Rest of Business stood out. For its part, the Corporate Center recorded higher losses, originating from exchange rate hedges.
The other operating income and expenses line accumulated, as of June 30, 2026, higher charges compared to the first half of 2025, mainly due to a more negative impact derived from hyperinflation. The above was partially offset by a better evolution of the results of the insurance business.
GROSS INCOME
(MILLIONS OF EUROS AT CONSTANT EXCHANGE RATES)
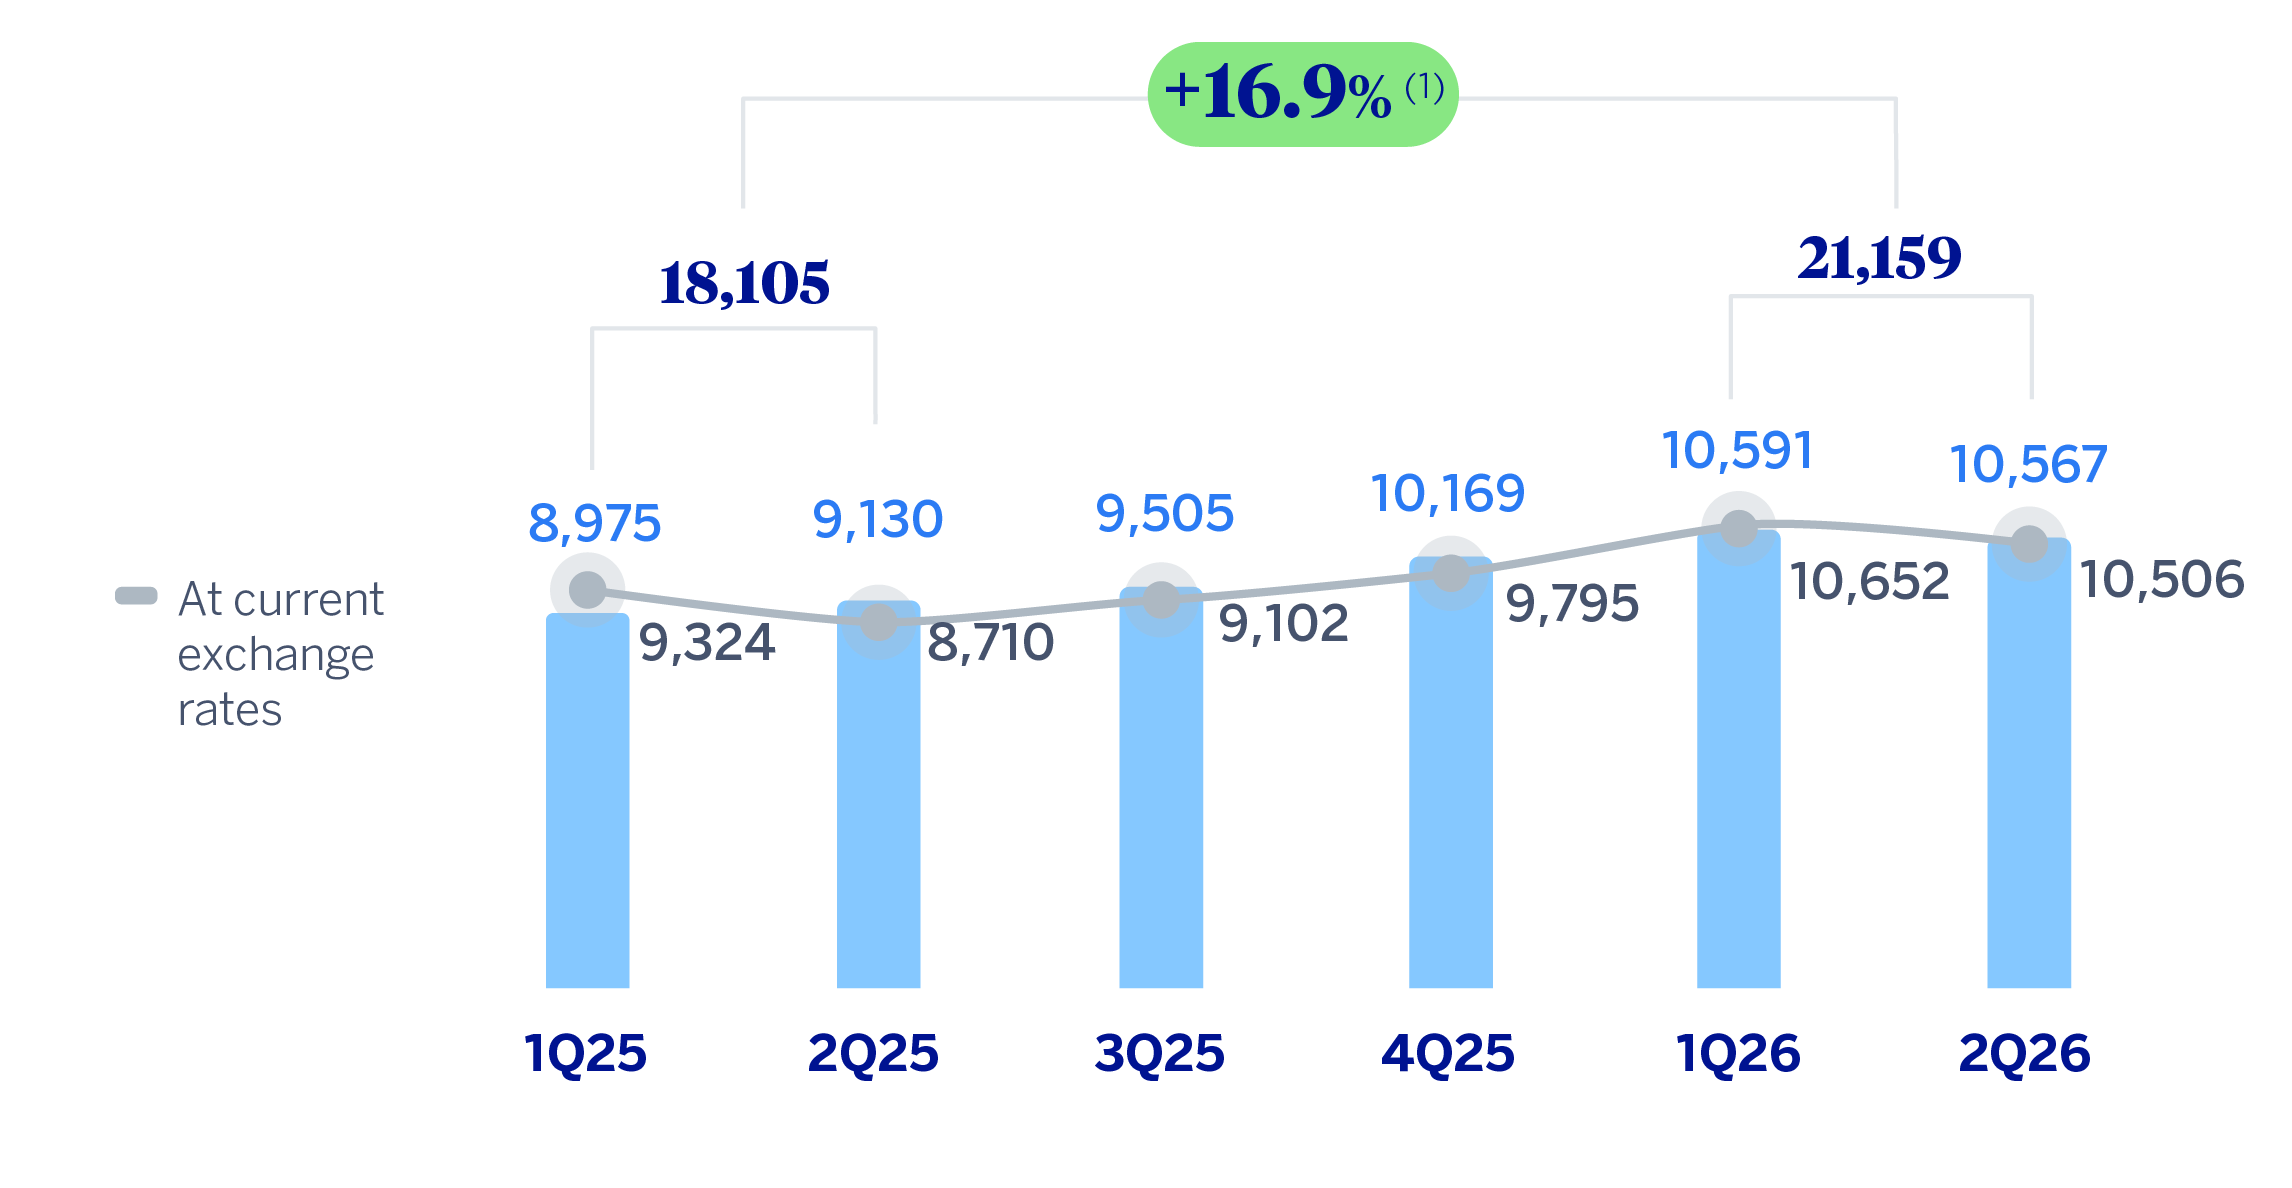
(1) At current exchange rates: +17.3%.
OPERATING EXPENSES
(MILLIONS OF EUROS AT CONSTANT EXCHANGE RATES)
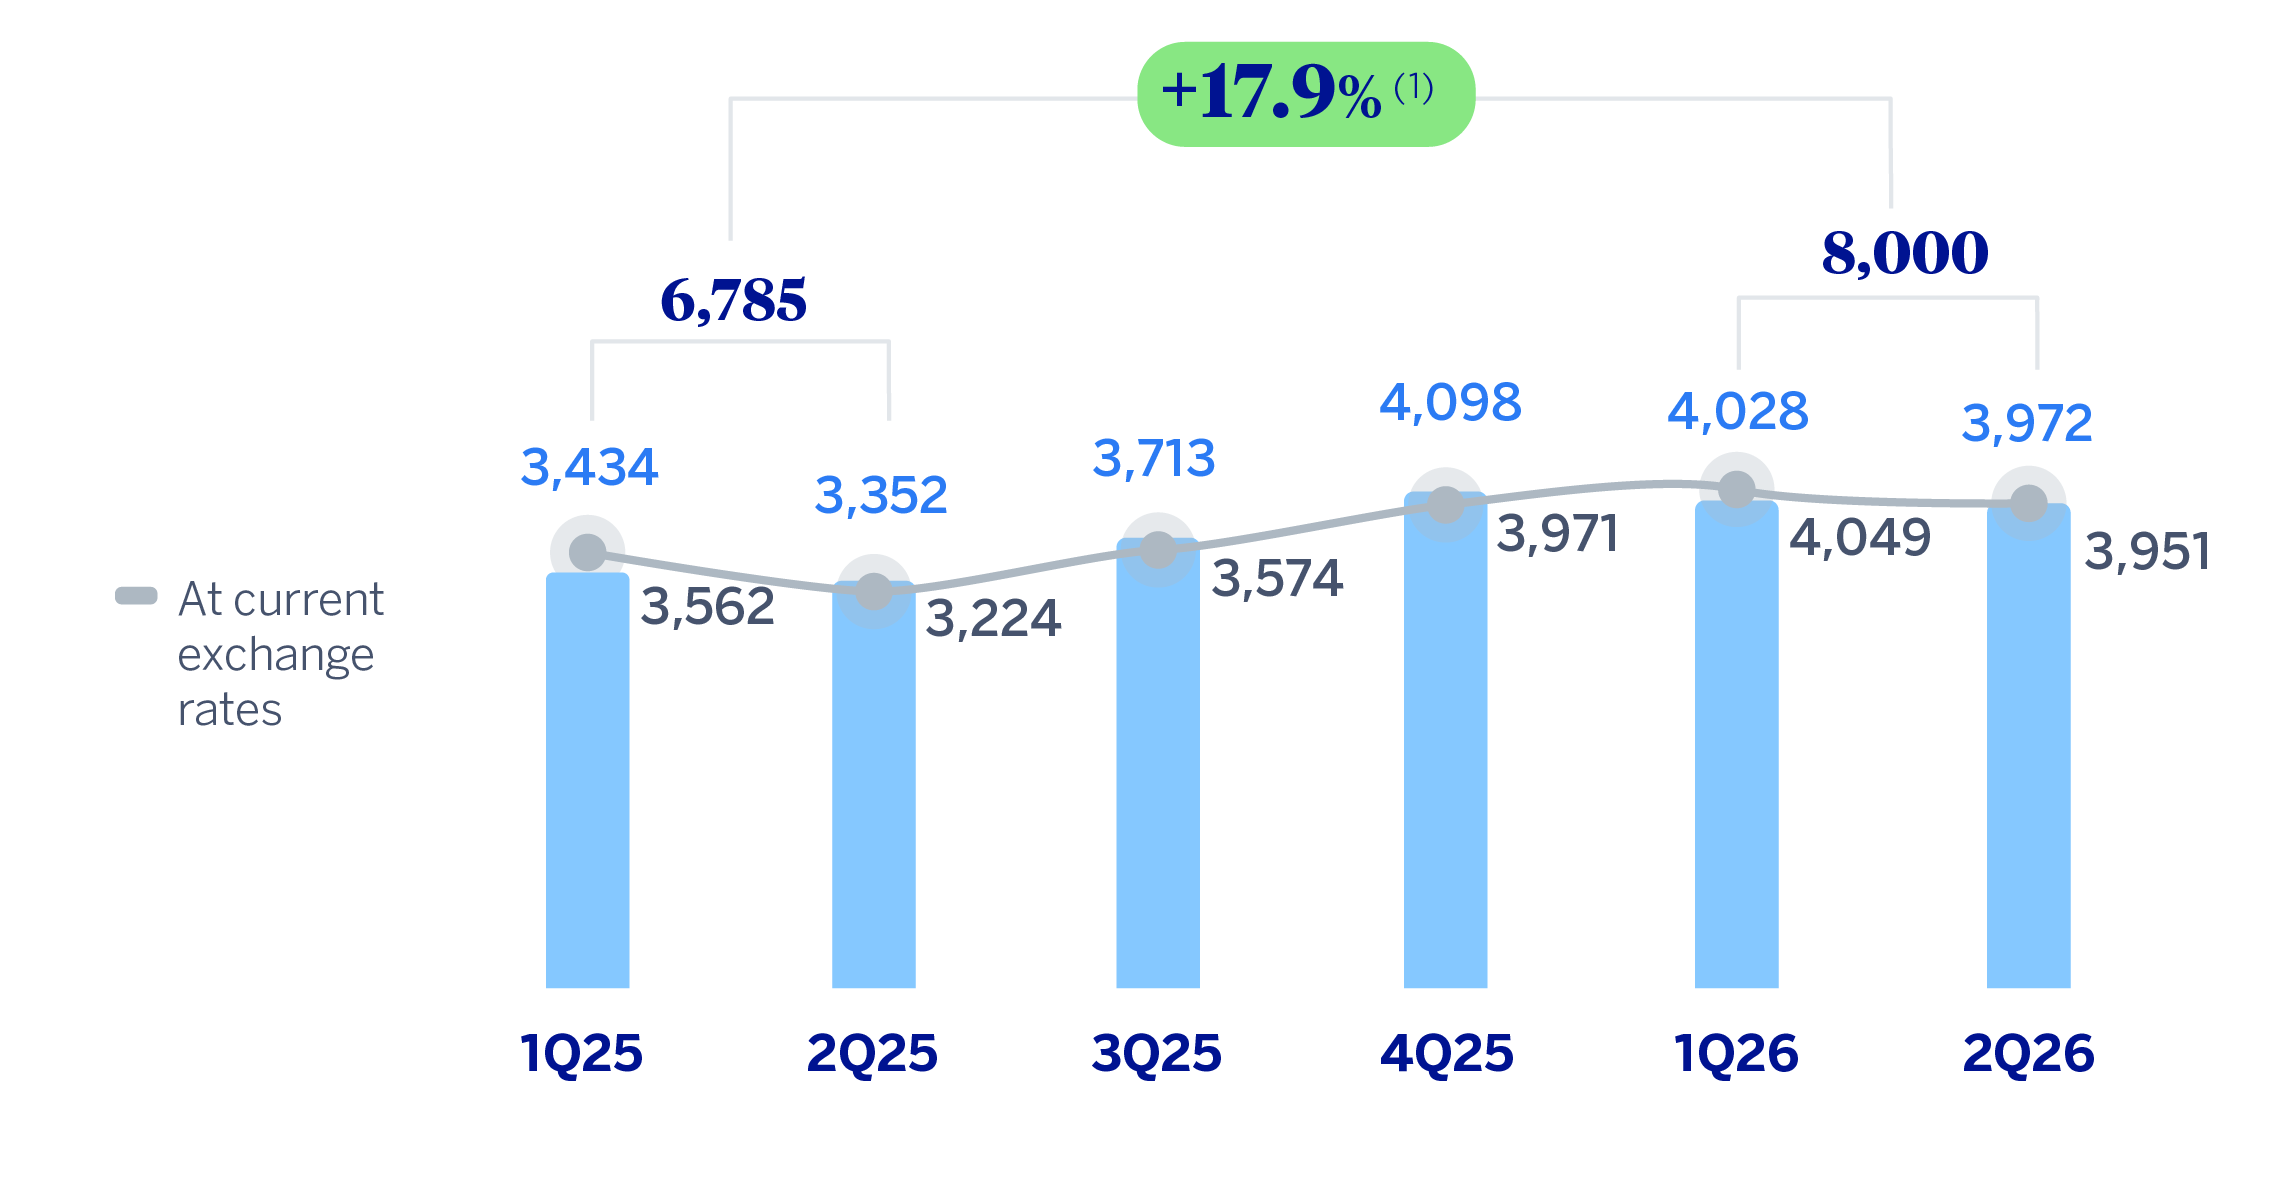
(1) At current exchange rates: +17.9%.
The year-on-year growth in operating expenses (+17.9%) stems from both higher general expenses, mainly in technology and taxes (both periods including the impact of the re-estimation of the applied pro-rata on the Value Added Tax at BBVA, S.A.) and personnel expenses, the latter including the impact of voluntary redundancies in 2026.
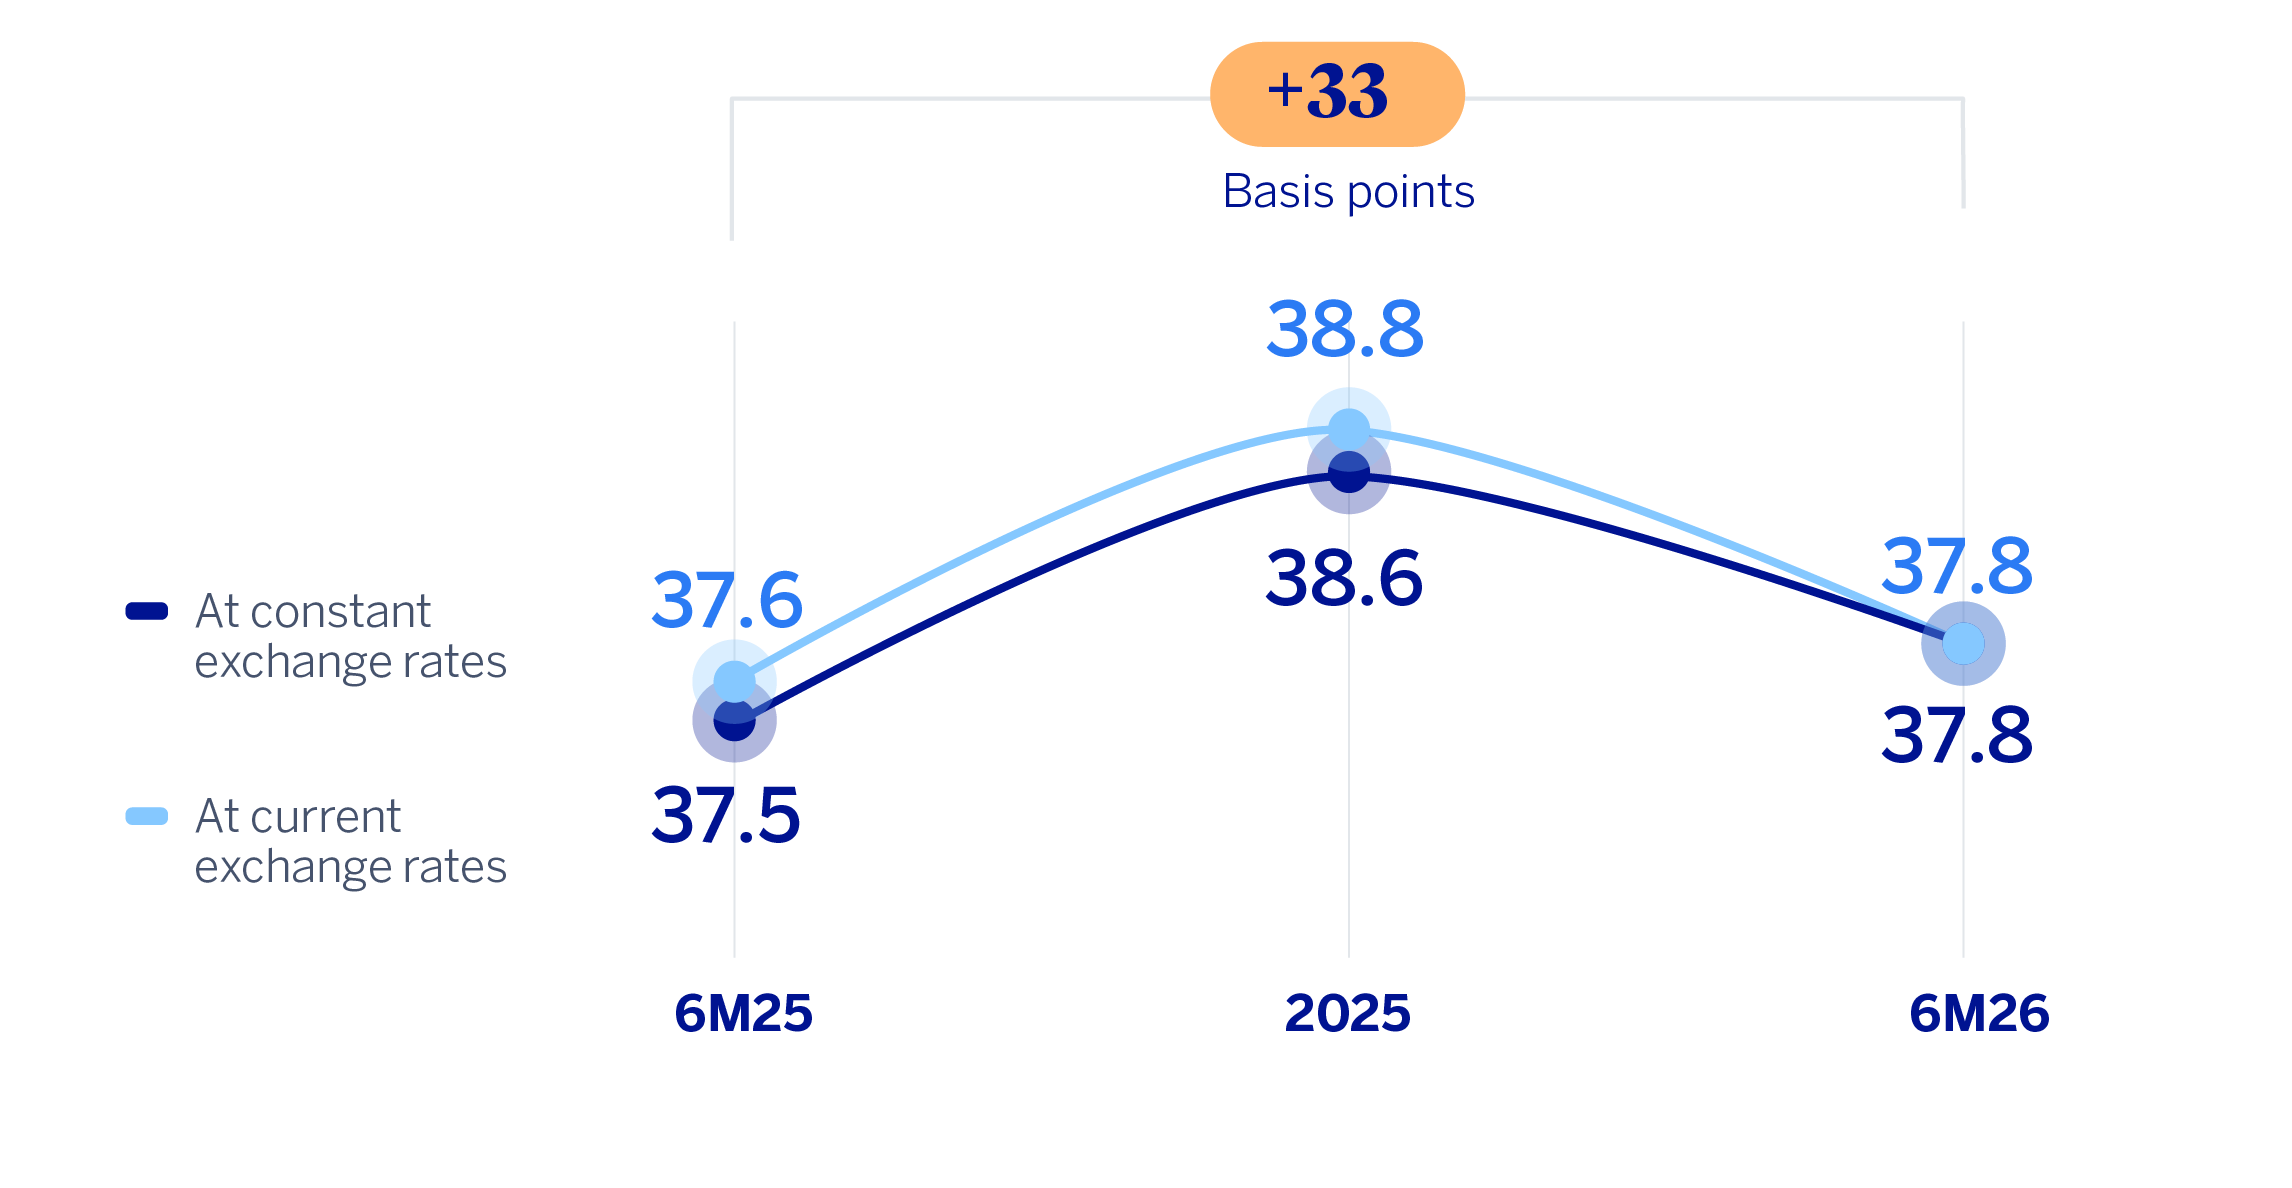
EFFICIENCY RATIO
(PERCENTAGE)
OPERATING INCOME
(MILLIONS OF EUROS AT CONSTANT EXCHANGE RATES)
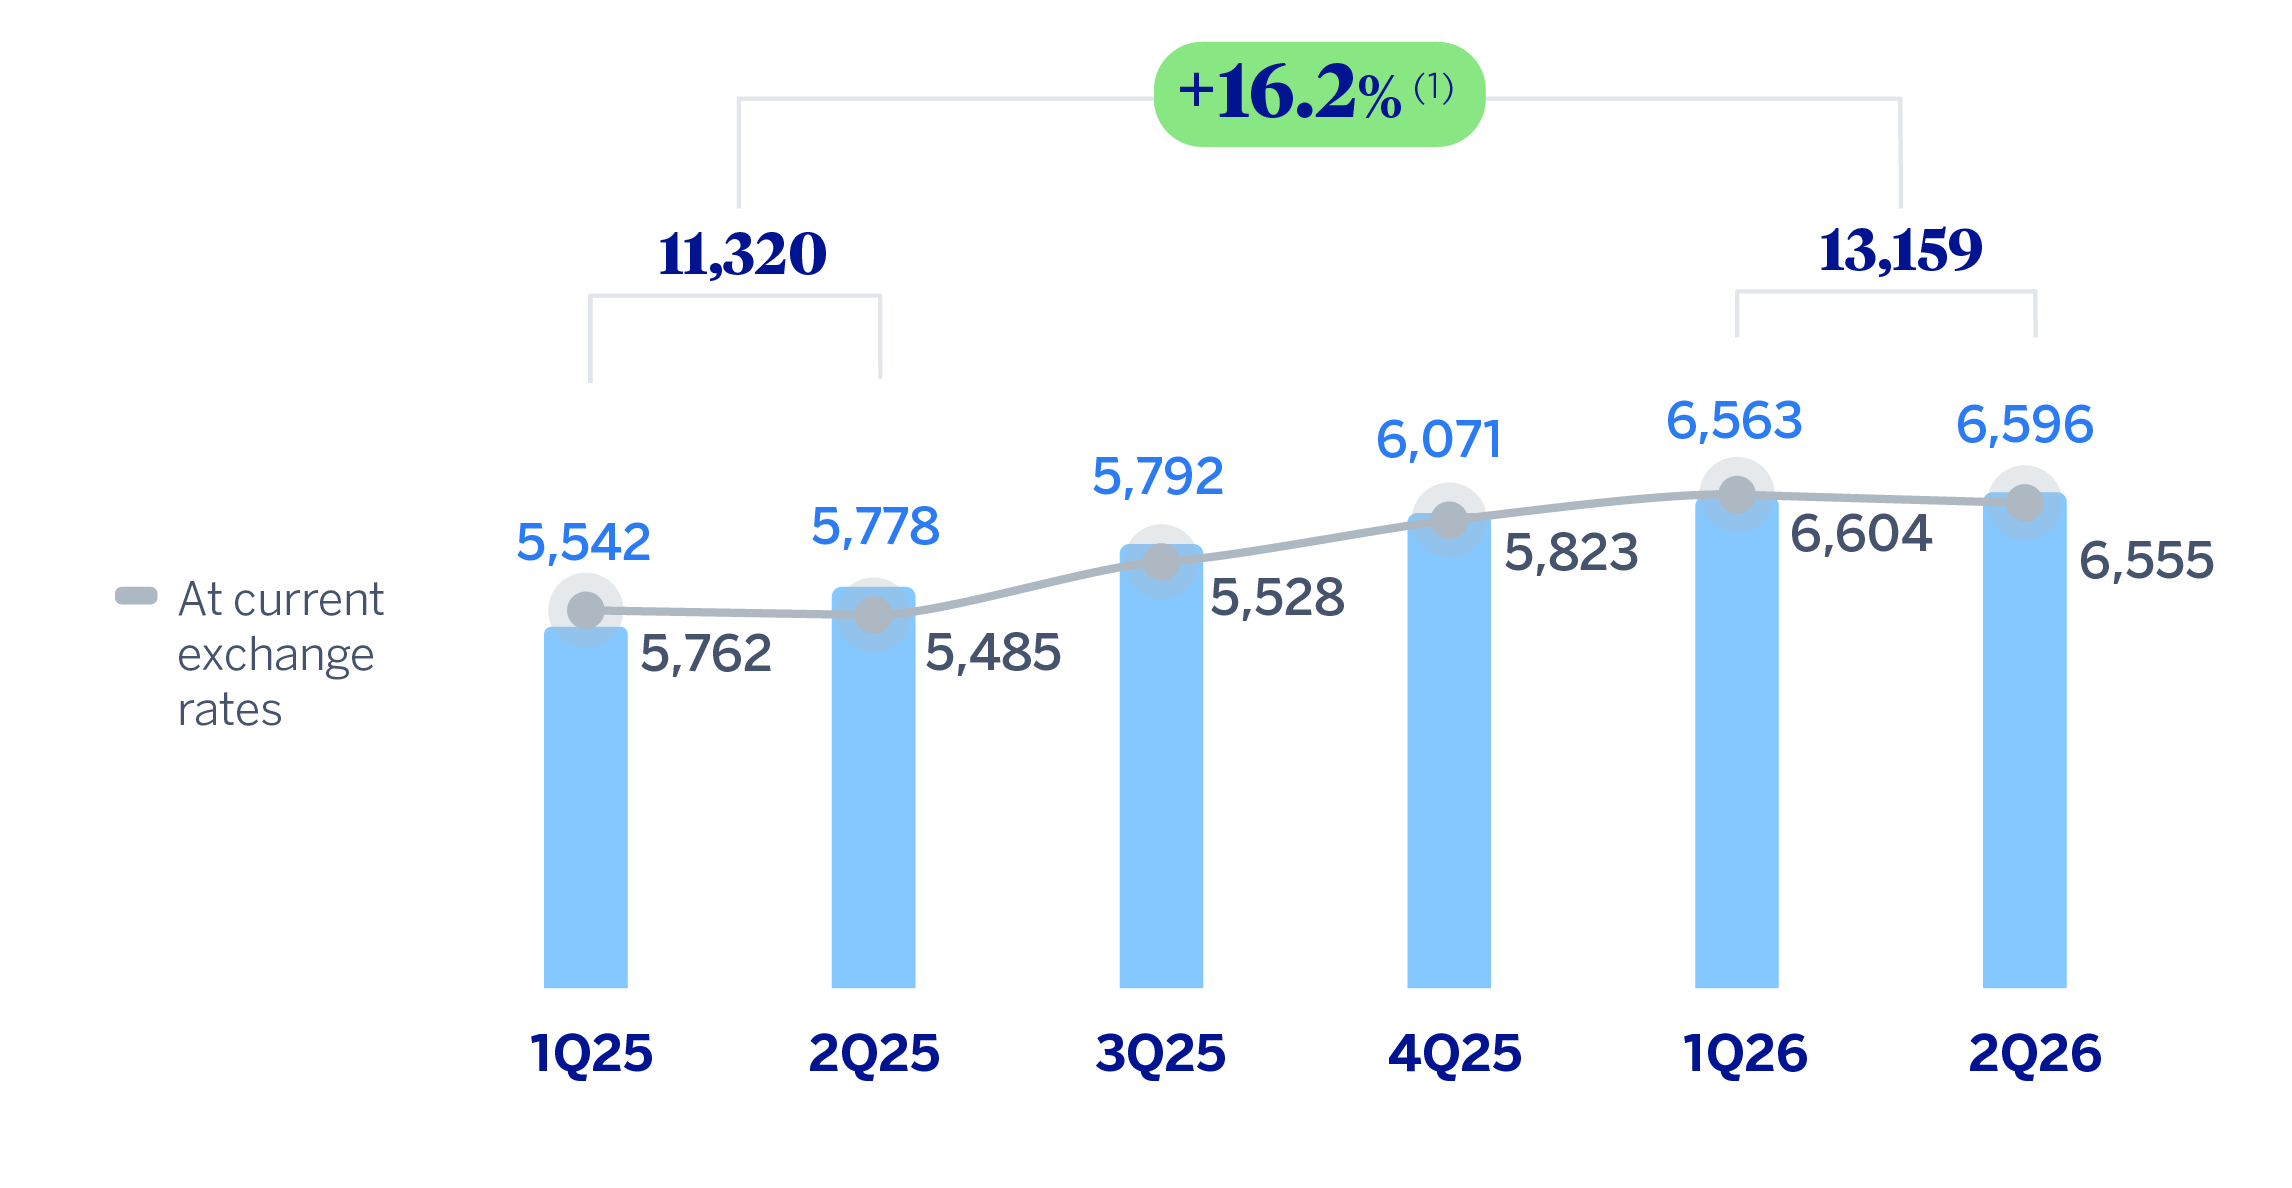
(1) At current exchange rates: +17.0%.
The increase in operating expenses was higher than the increase in gross income, which caused an increase of 33 basis points in the efficiency ratio. Excluding from the year-on-year comparison the aforementioned re-estimation of the applied pro-rata on the Value Added Tax, with an impact in both periods, and the voluntary redundancies in 2026, the efficiency ratio would decrease by 77 basis points.
The impairment on financial assets not measured at fair value through profit or loss (hereinafter, impairment on financial assets) stood at the end of June 2026 at 24.2% higher than in the same period of the previous year, in a context of activity growth, although it shows a decrease of 6.5% compared to the previous quarter. This evolution is largely explained by the higher provisions made mainly in Turkey, South America and Mexico.
IMPAIRMENT ON FINANCIAL ASSETS
(MILLIONS OF EUROS AT CONSTANT EXCHANGE RATES)
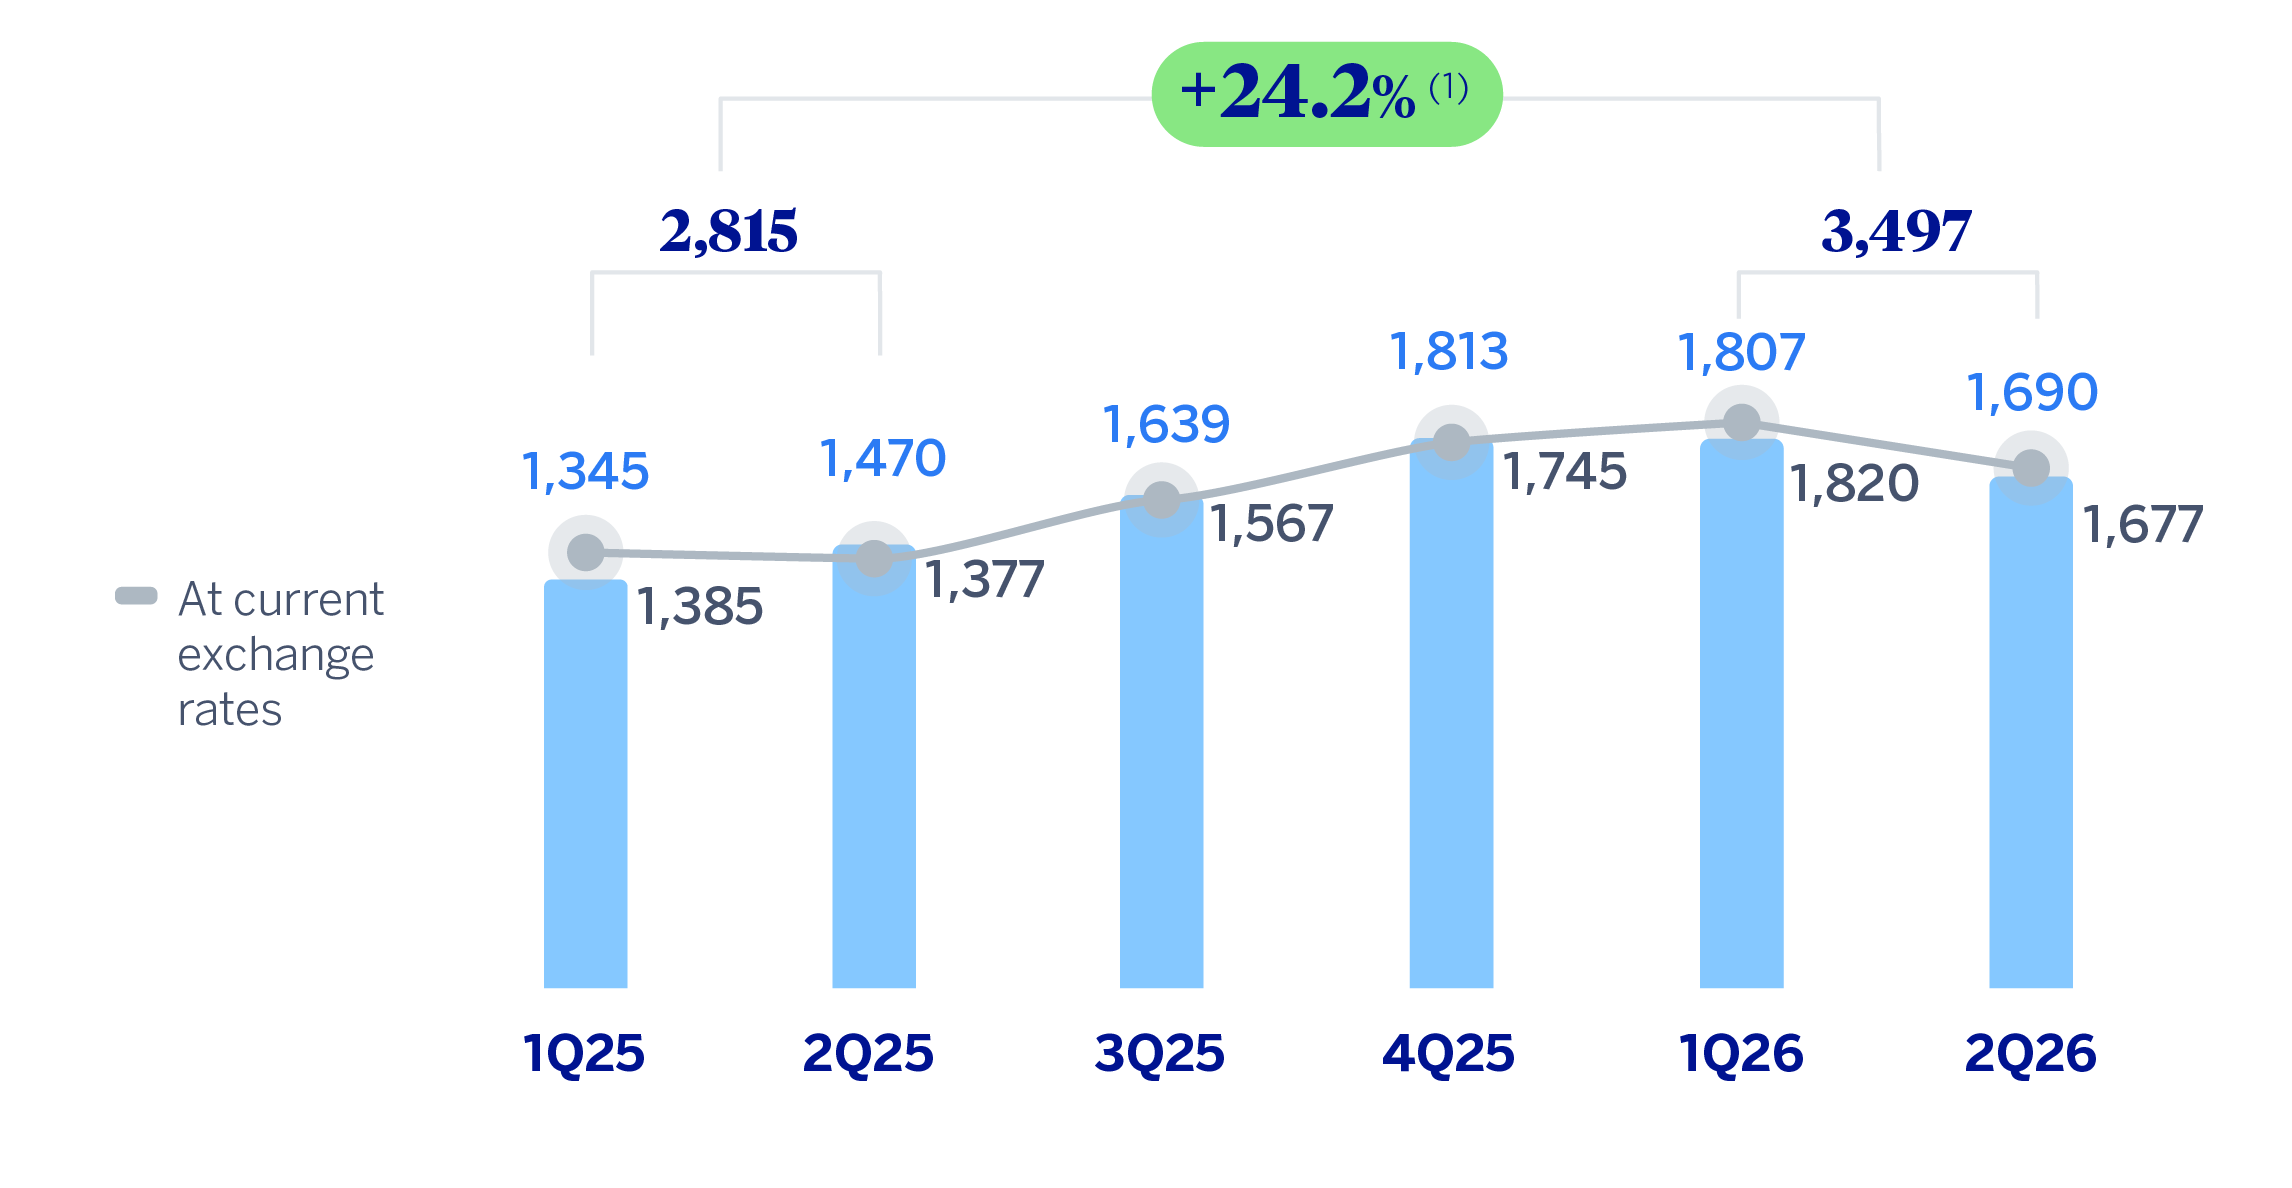
(1) At current exchange rates: +26.6%.
The provisions or reversal of provisions line (hereinafter, provisions) registered as of June 30, 2026 lower provisions (-28.8% year-on-year) in all business areas except for Turkey.
On the other hand, the other gains (losses) line ended in the first half of 2026, 79.5% lower than the same period in 2025.
Income tax includes the accrual corresponding to the first half of 2026 of the tax on net interest income and net fees and commissions in Spain, which amounts to approximately €149 million, in line with the €150 million accrued in the first half of 2025.
As a result of the above, the BBVA Group reached a net attributable profit of €6,051 million accumulated at the end of the first half of 2026, showing growth of 10.0% compared to the same period of the previous year. This solid result is based on the strength of the net interest income, which offsets the increase in operating expenses and the provisions for impairment losses on financial assets in a context of loan growth.
The net attributable profits, in millions of euros and accumulated at the end of June 2026, for the business areas that compose the Group were as follows: 2,172 in Spain, 2,979 in Mexico, 532 in Turkey, 556 in South America and 508 in Rest of Business.
NET ATTRIBUTABLE PROFIT (LOSS)
(MILLIONS OF EUROS AT CONSTANT EXCHANGE RATES)
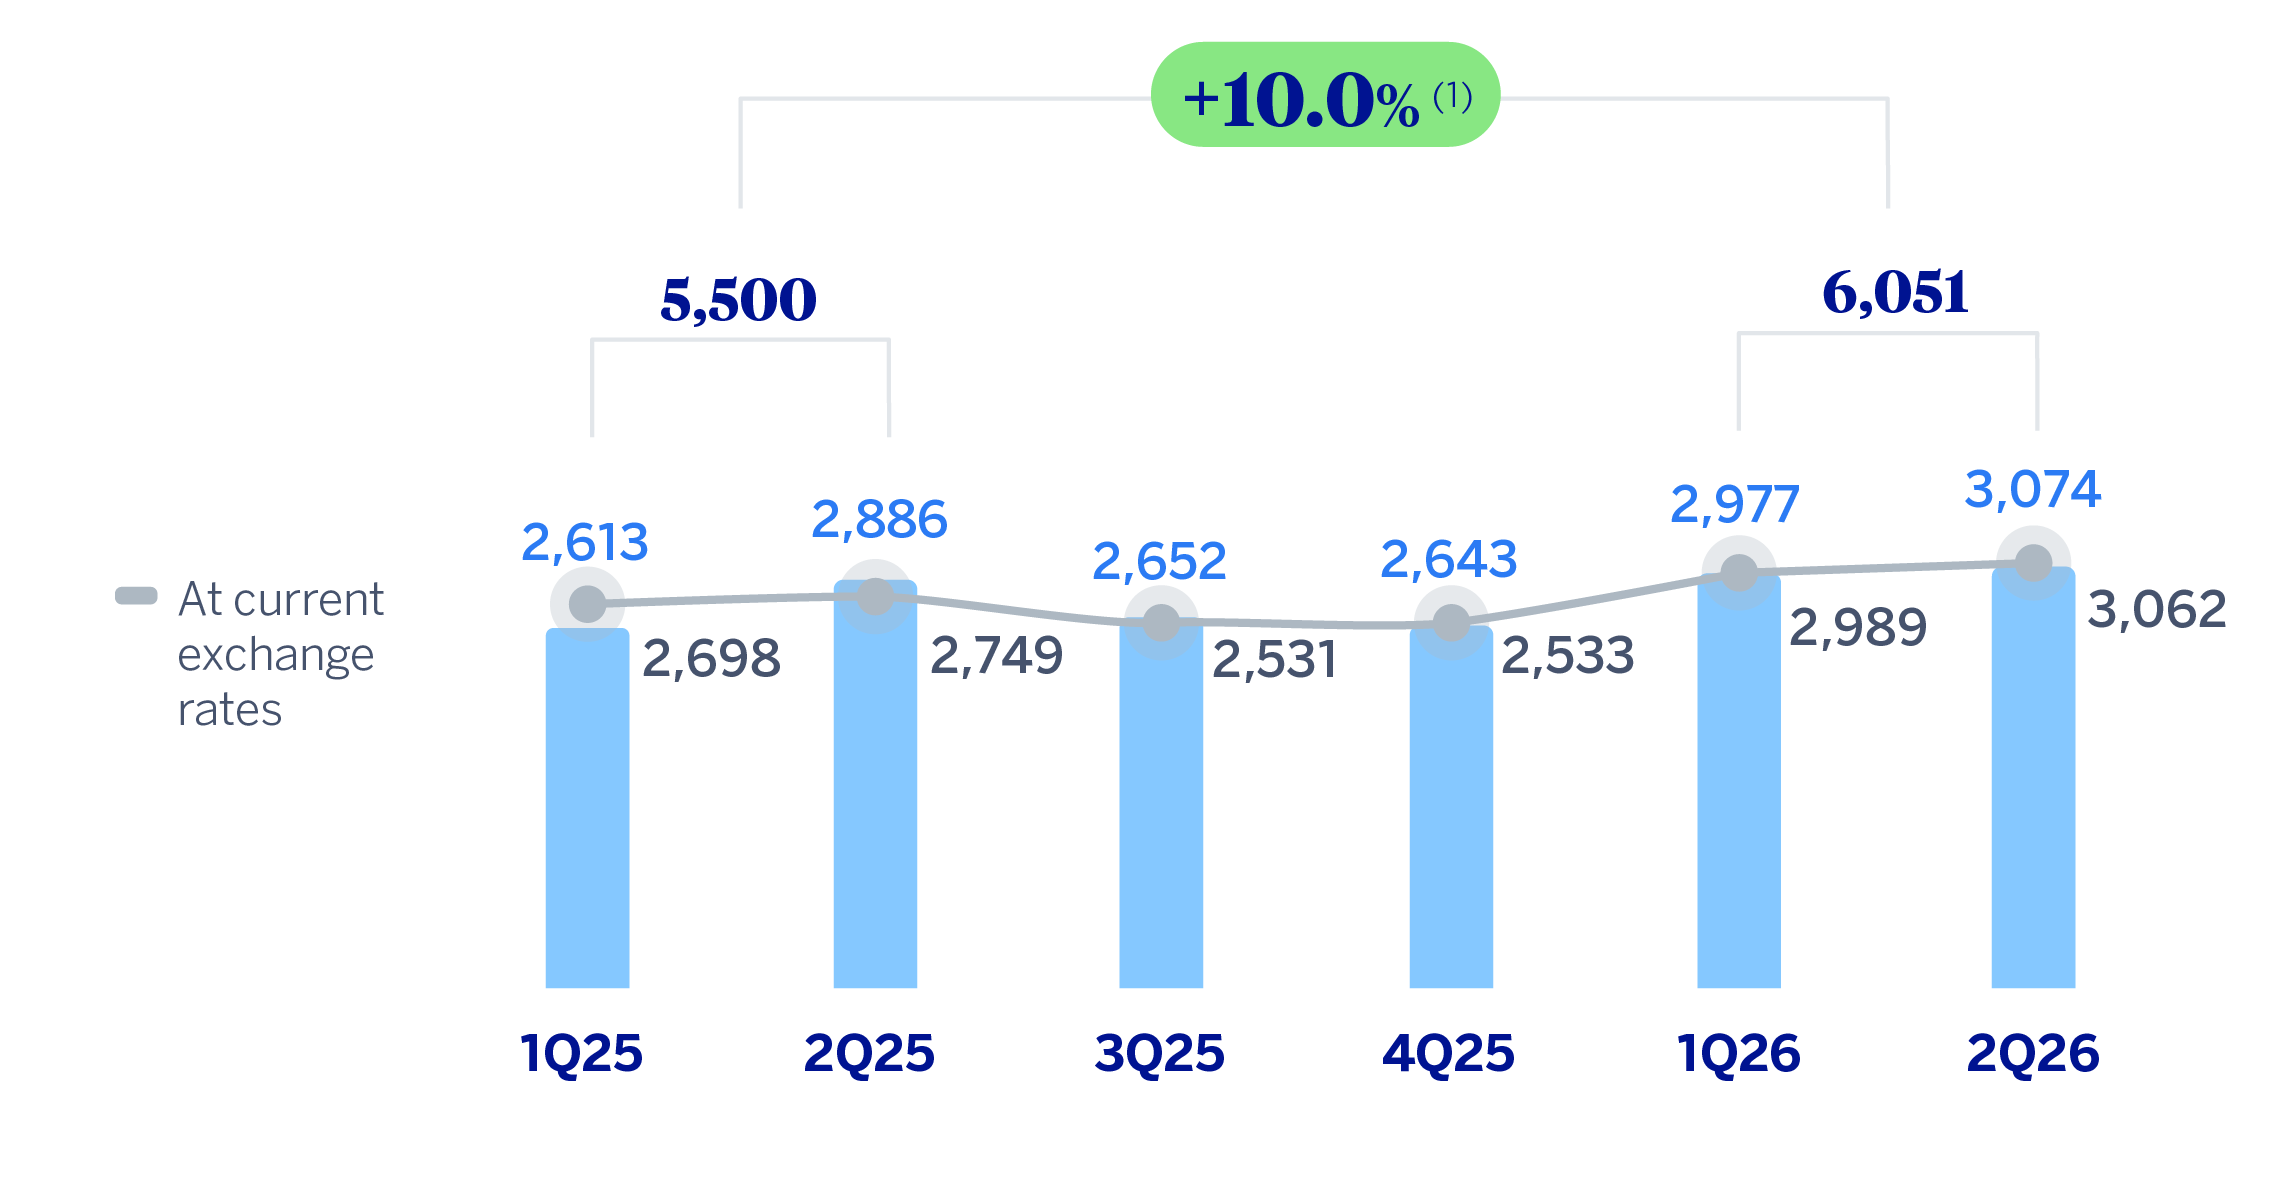
(1) At current exchange rates: +11.1%.
The Group's excellent performance has also allowed it to continue generating value, as is reflected in the growth of the tangible book value per share and dividends, which at the end of June 2026 was 17.3% higher than at the same period of the previous year.
TANGIBLE BOOK VALUE PER SHARE AND DIVIDENDS
(EUROS)
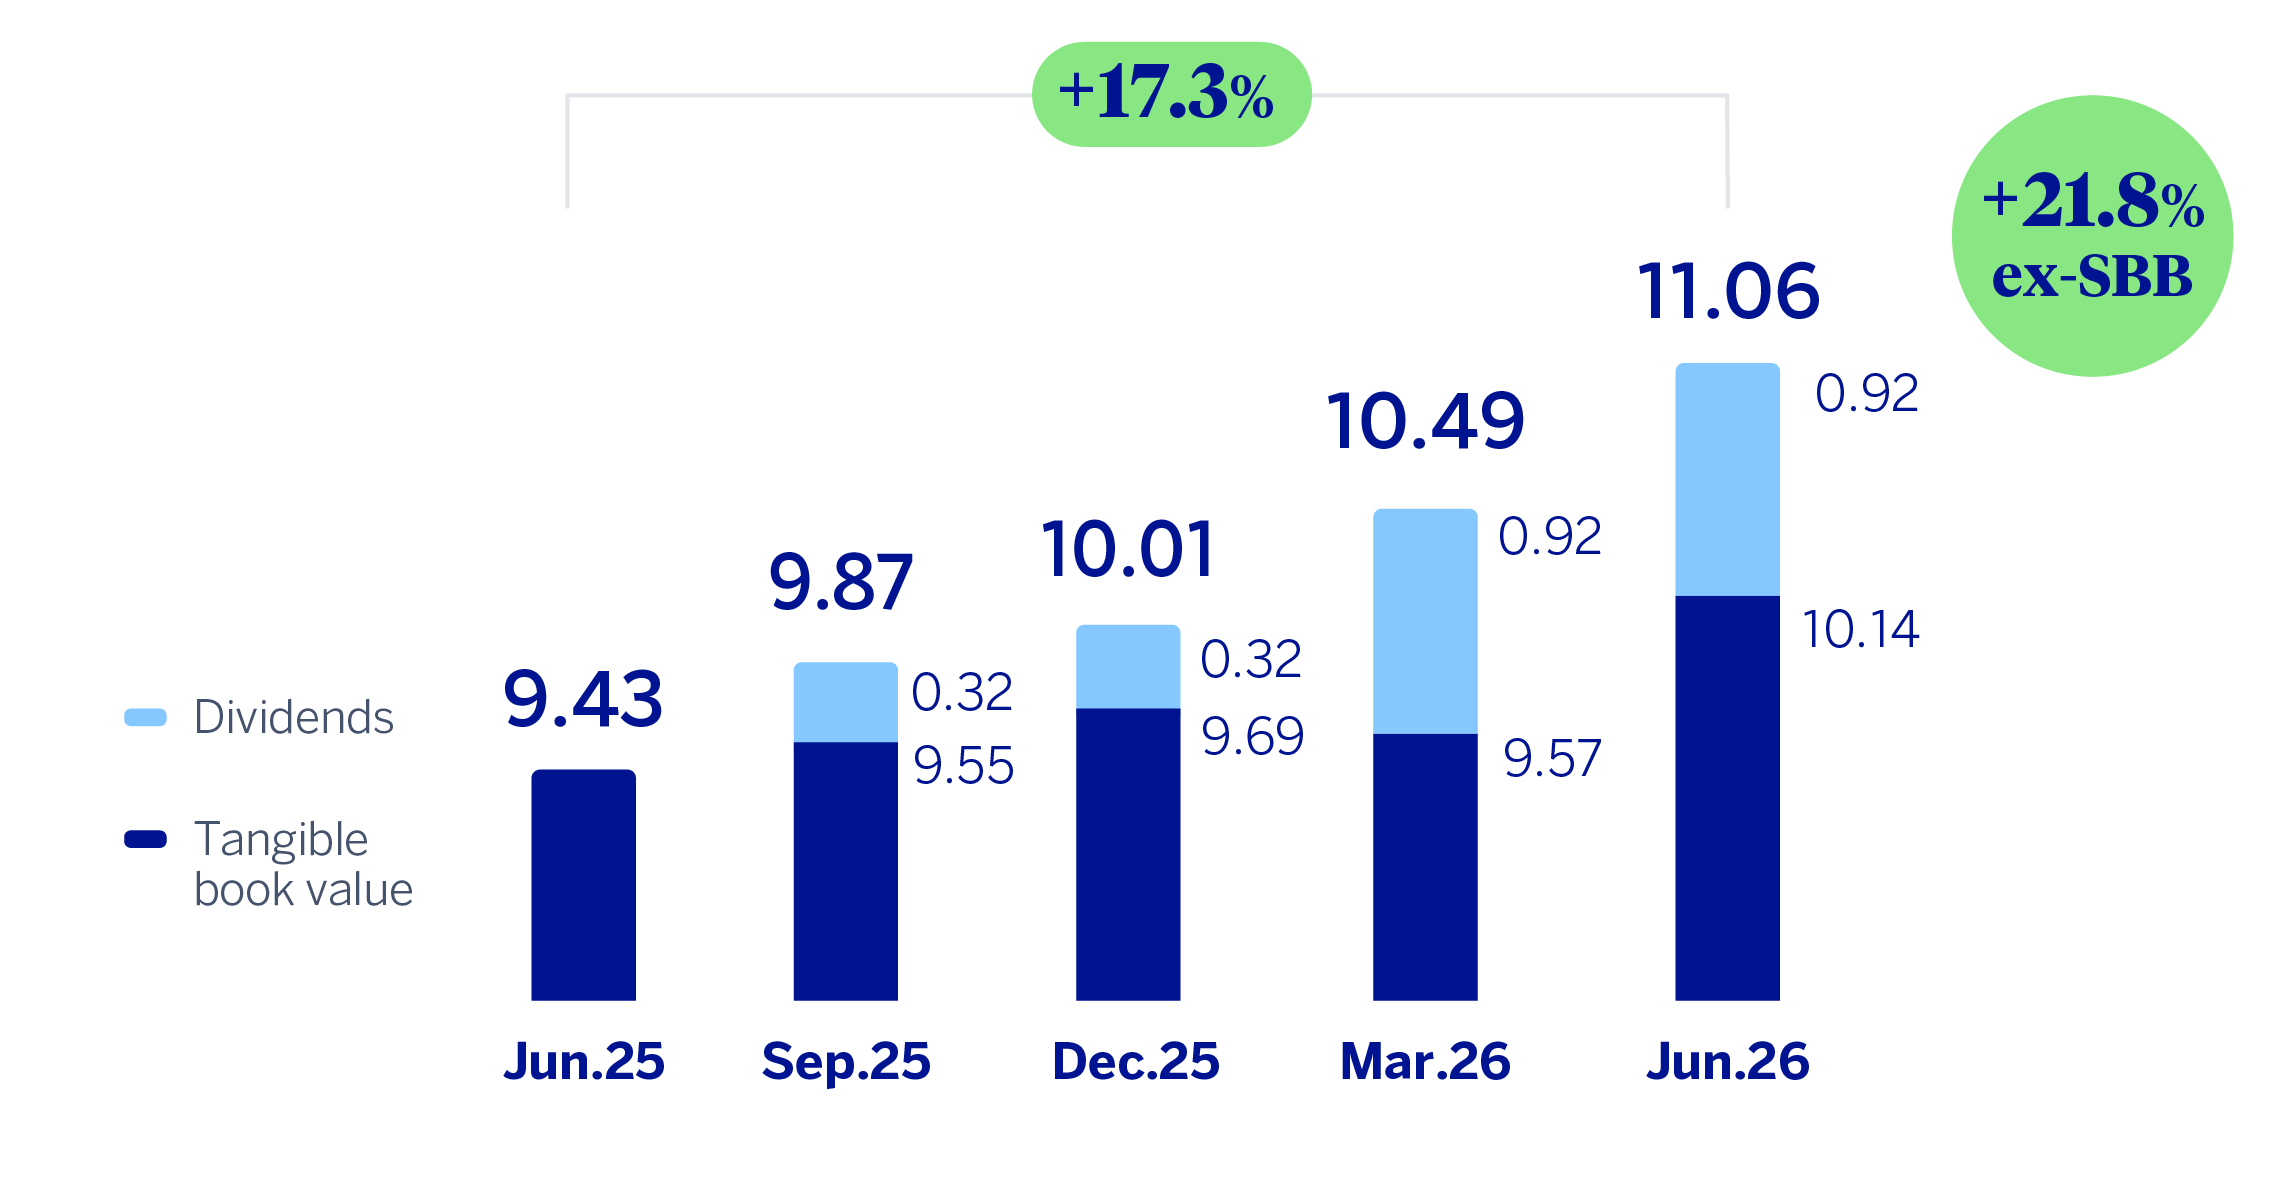
General note: Replenishing dividends paid in the period. For more information, see Alternative Performance Measures at this report.
EARNINGS (LOSS) PER SHARE
(EUROS)
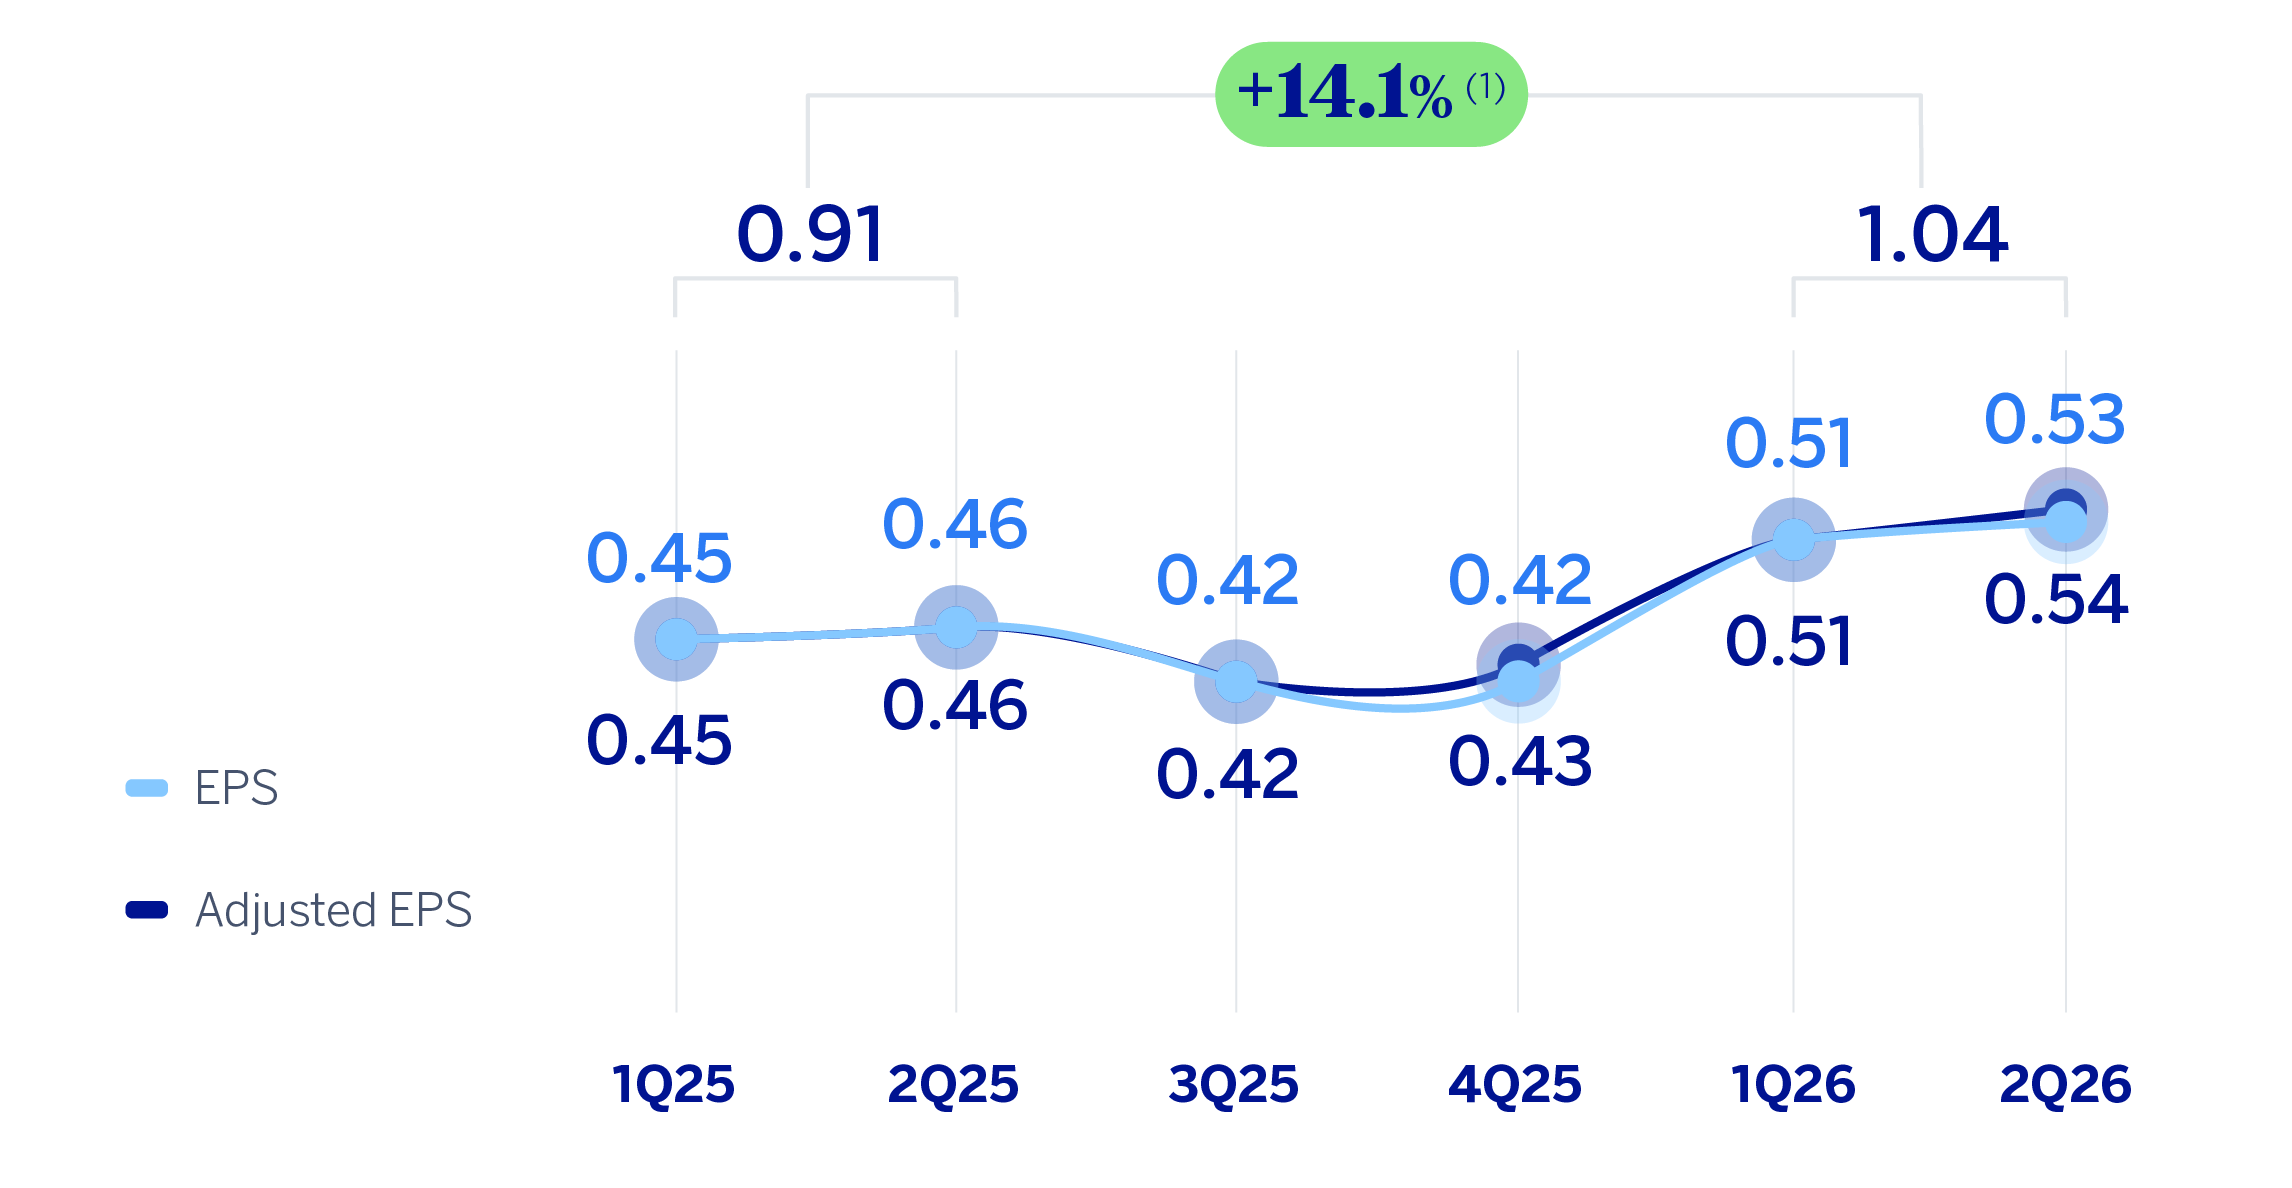
General note: Adjusted by additional Tier 1 instrument remuneration. For more information, see Alternative Performance Measures at this report.
(1) The year-on-year variation of adjusted EPS stands at 15.8%.
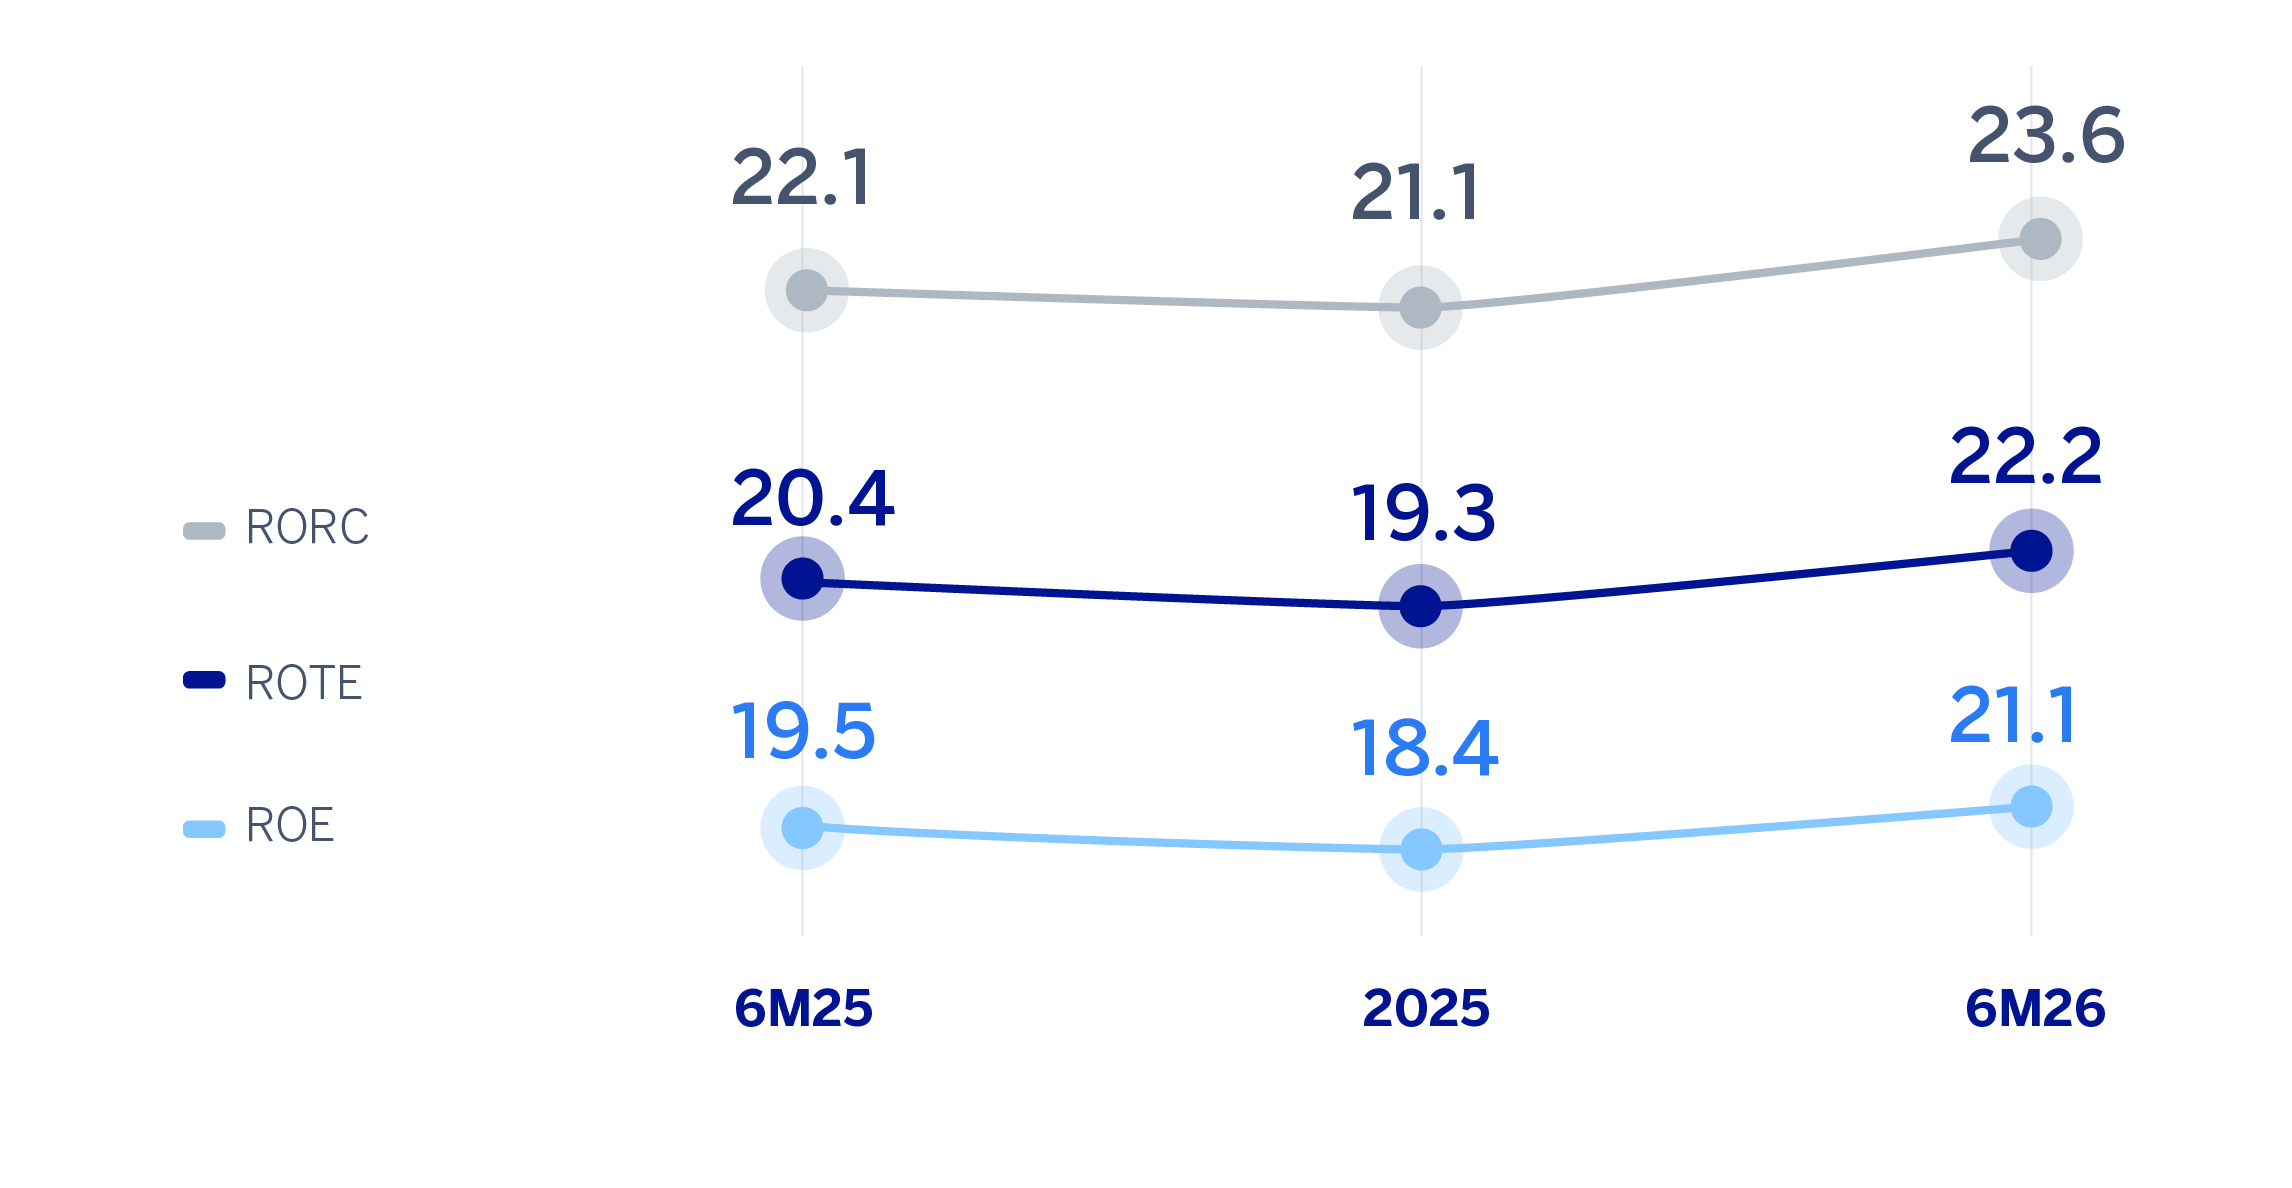
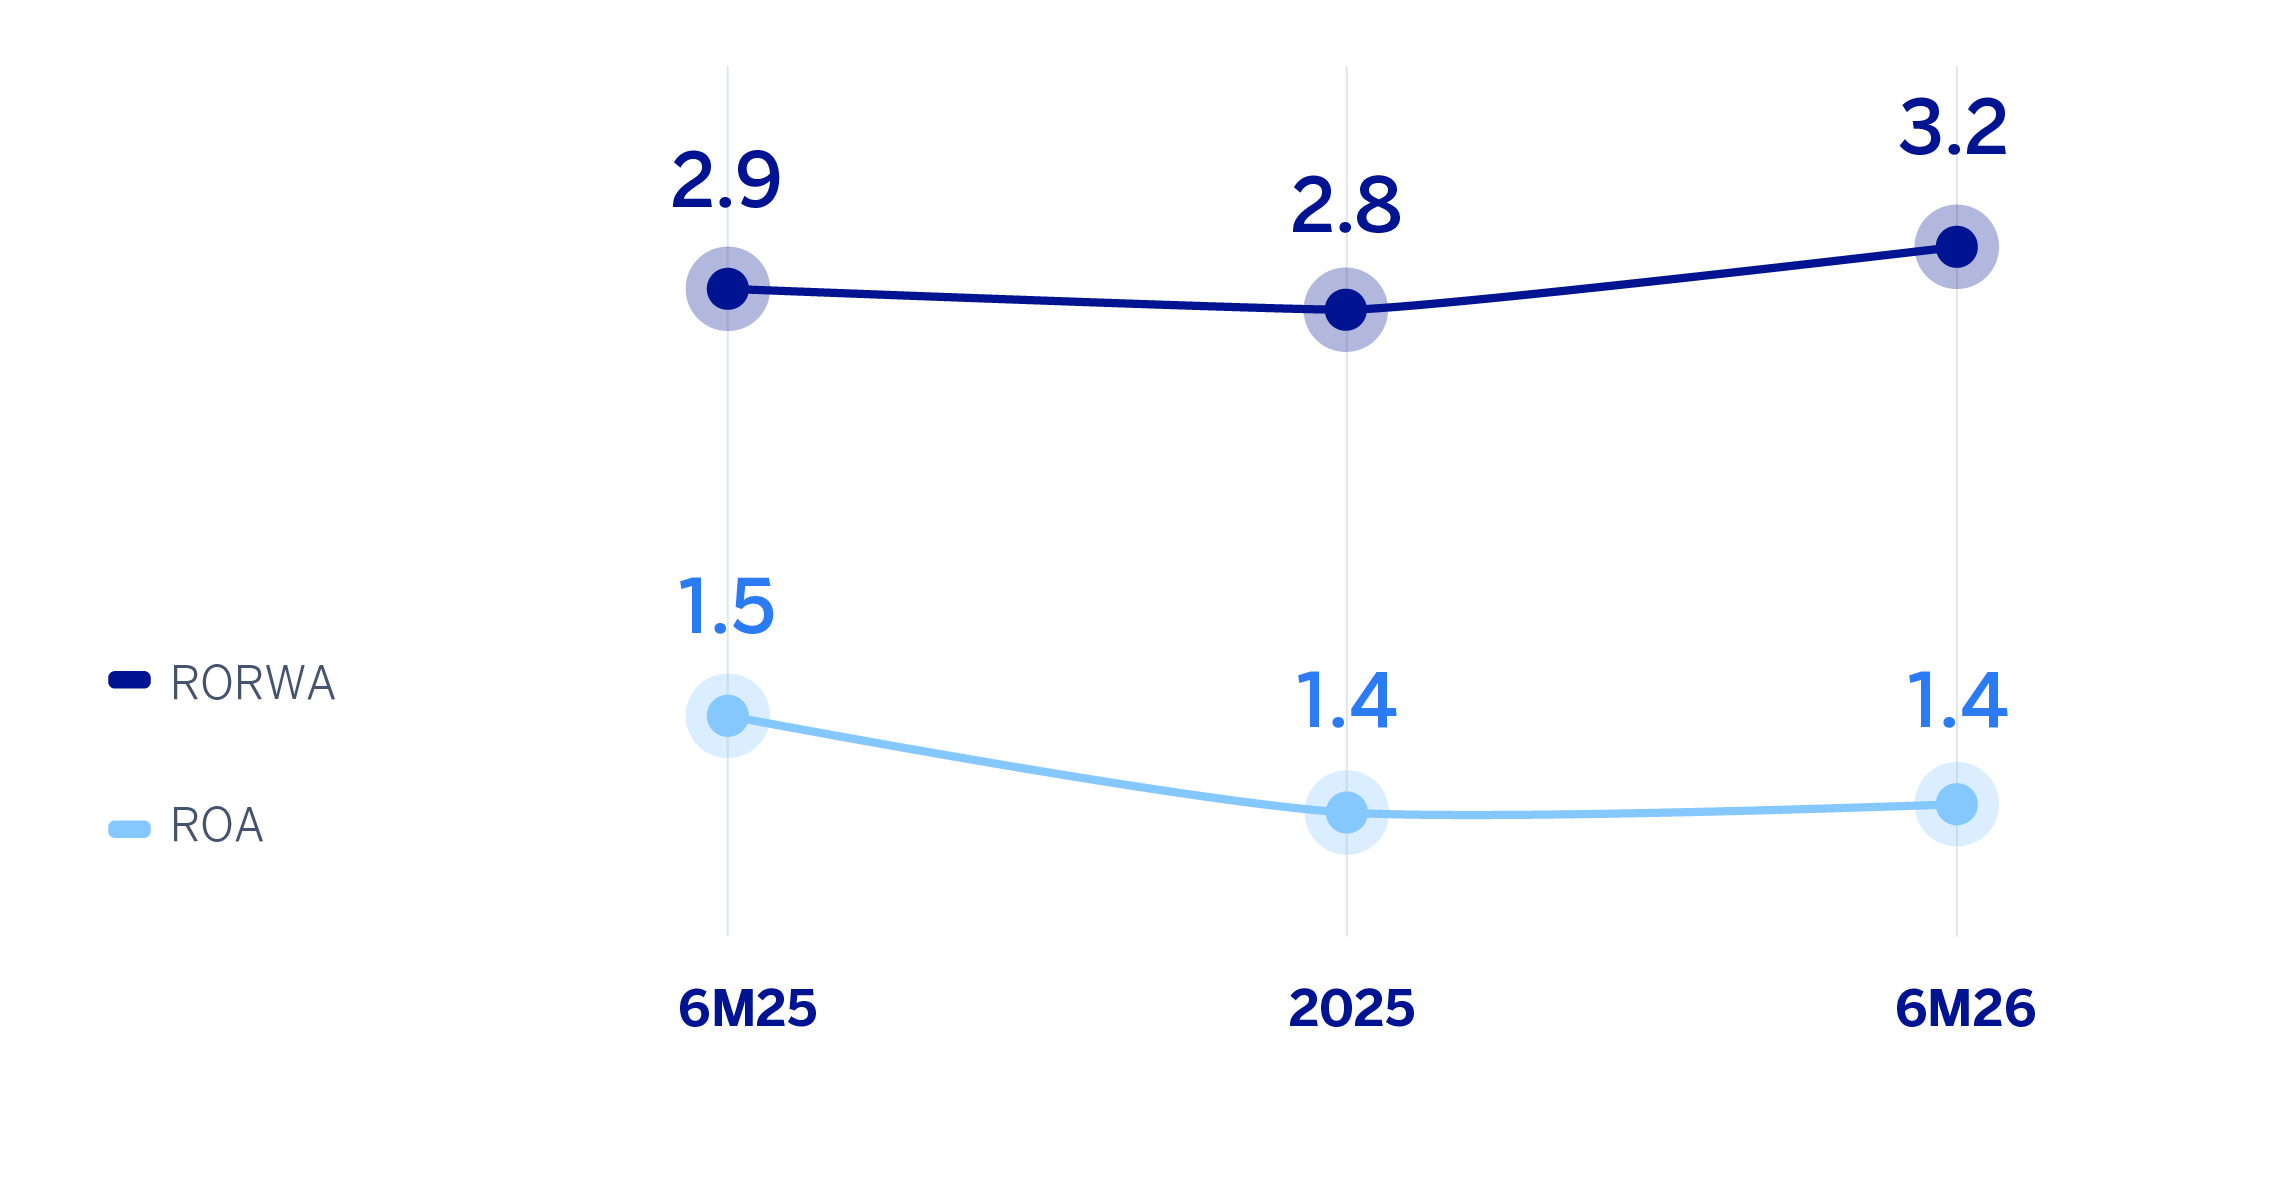
Lastly, the Group’s profitability indicators show BBVA's ability to combine higher growth rates and profitability ratios at high levels in a way that differentiates it from the market.
ROE, ROTE AND RORC (PERCENTAGE)
ROA AND RORWA (PERCENTAGE)
Read legal disclaimer of this report.