


Rest of Business
Highlights for the period January - June 2026
- Dynamism in lending activity and stability of customer funds, driven by growth in the second quarter
- Favorable performance of recurring revenues
- Positive evolution of the efficiency ratio
- Double-digit growth in net attributable profit
BUSINESS ACTIVITY (1) (VARIATION AT CONSTANT EXCHANGE RATES COMPARED TO 31-12-25)
(1) Excluding repos.
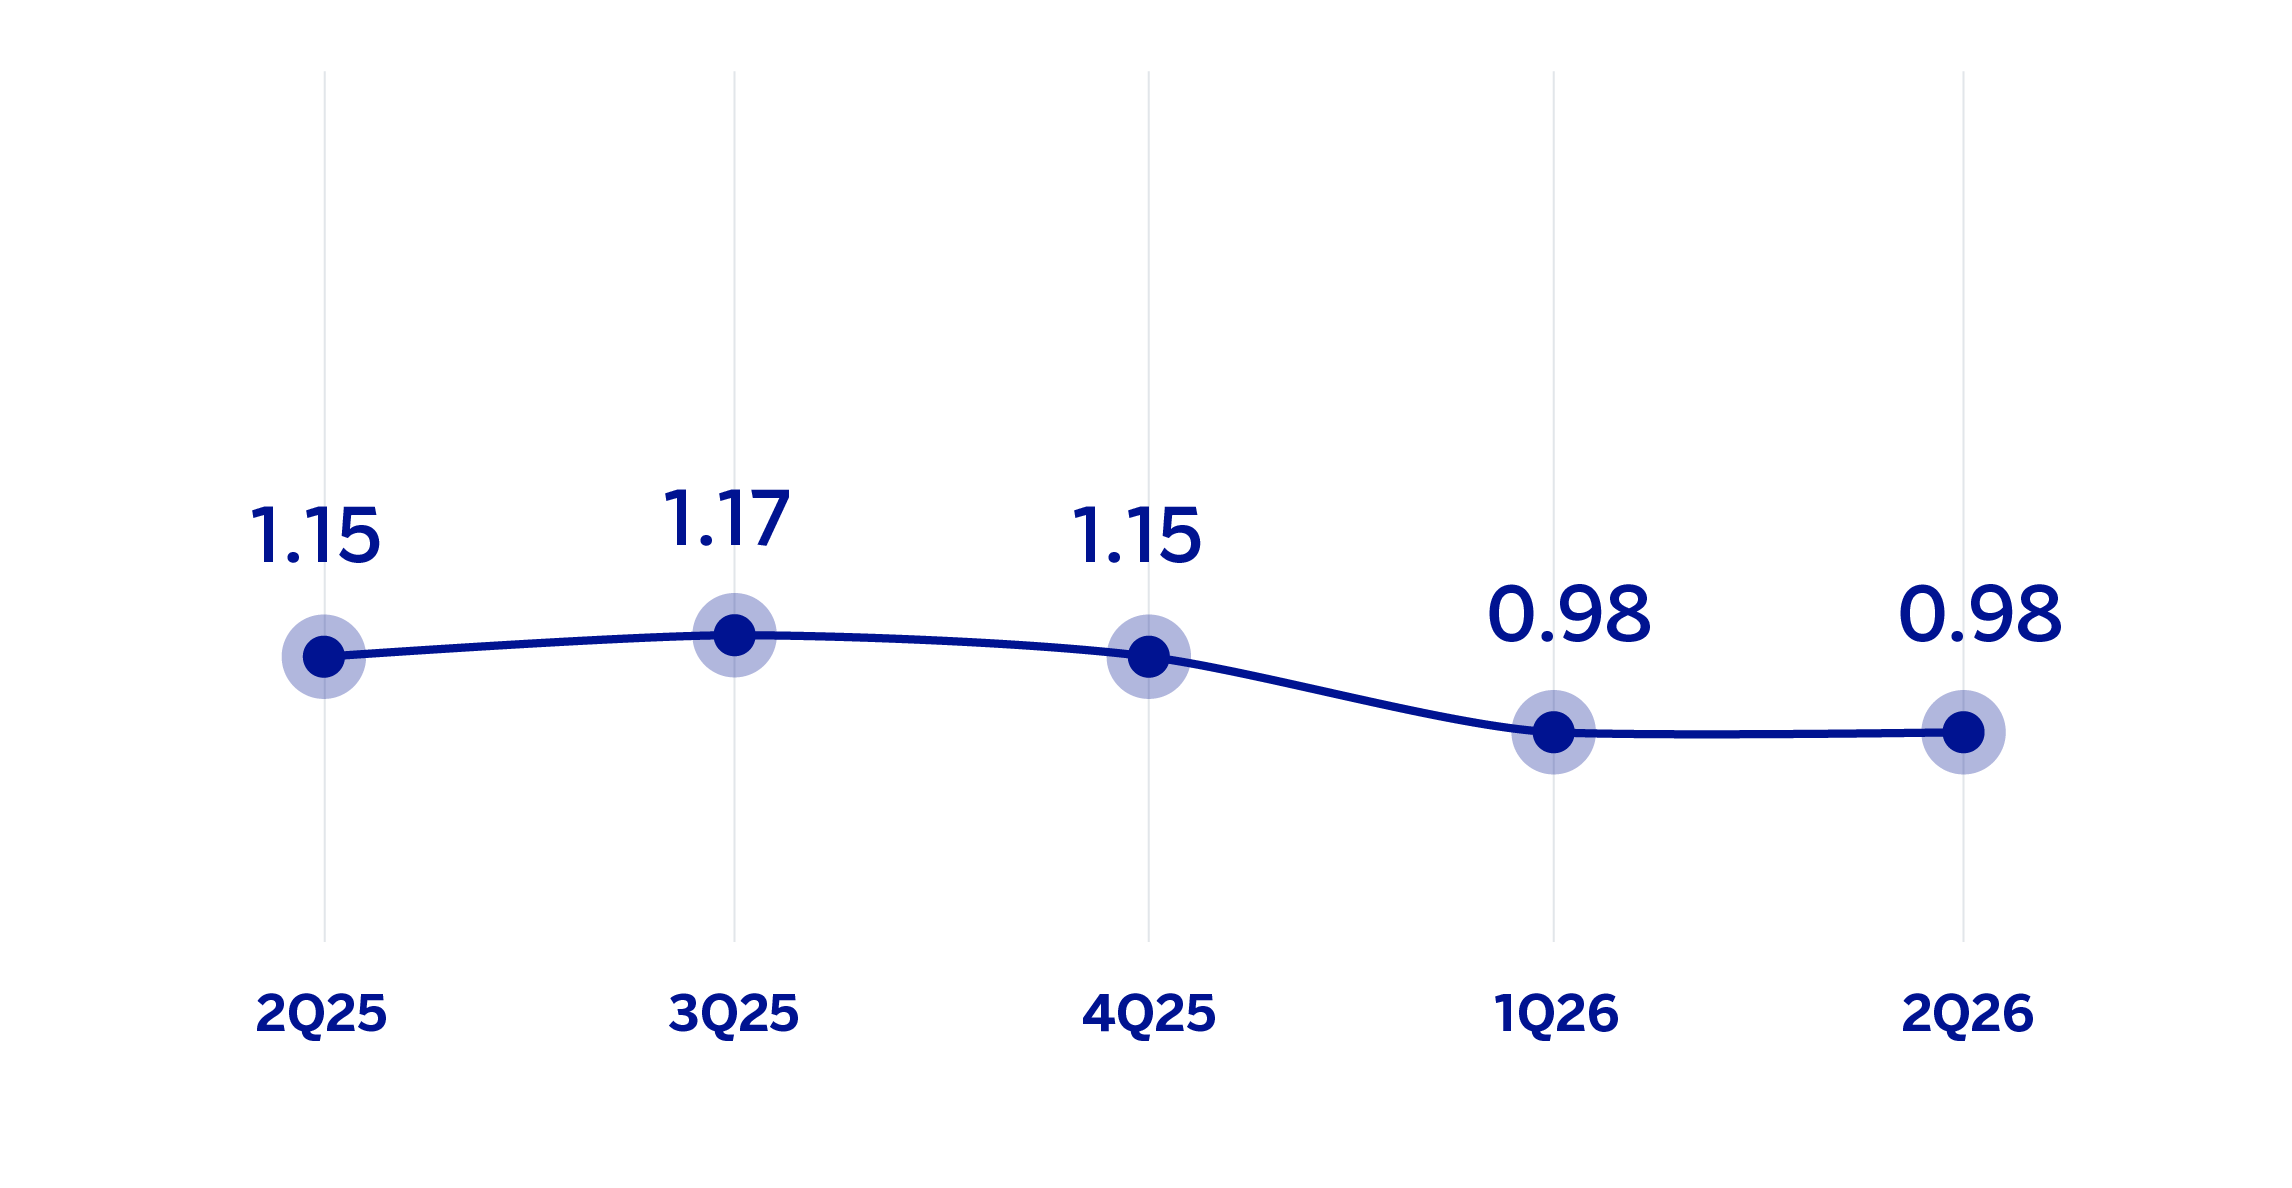
NET INTEREST INCOME / AVERAGE TOTAL ASSETS
(PERCENTAGE AT CONSTANT EXCHANGE RATES)
OPERATING INCOME
(MILLIONS OF EUROS AT CONSTANT EXCHANGE RATES)
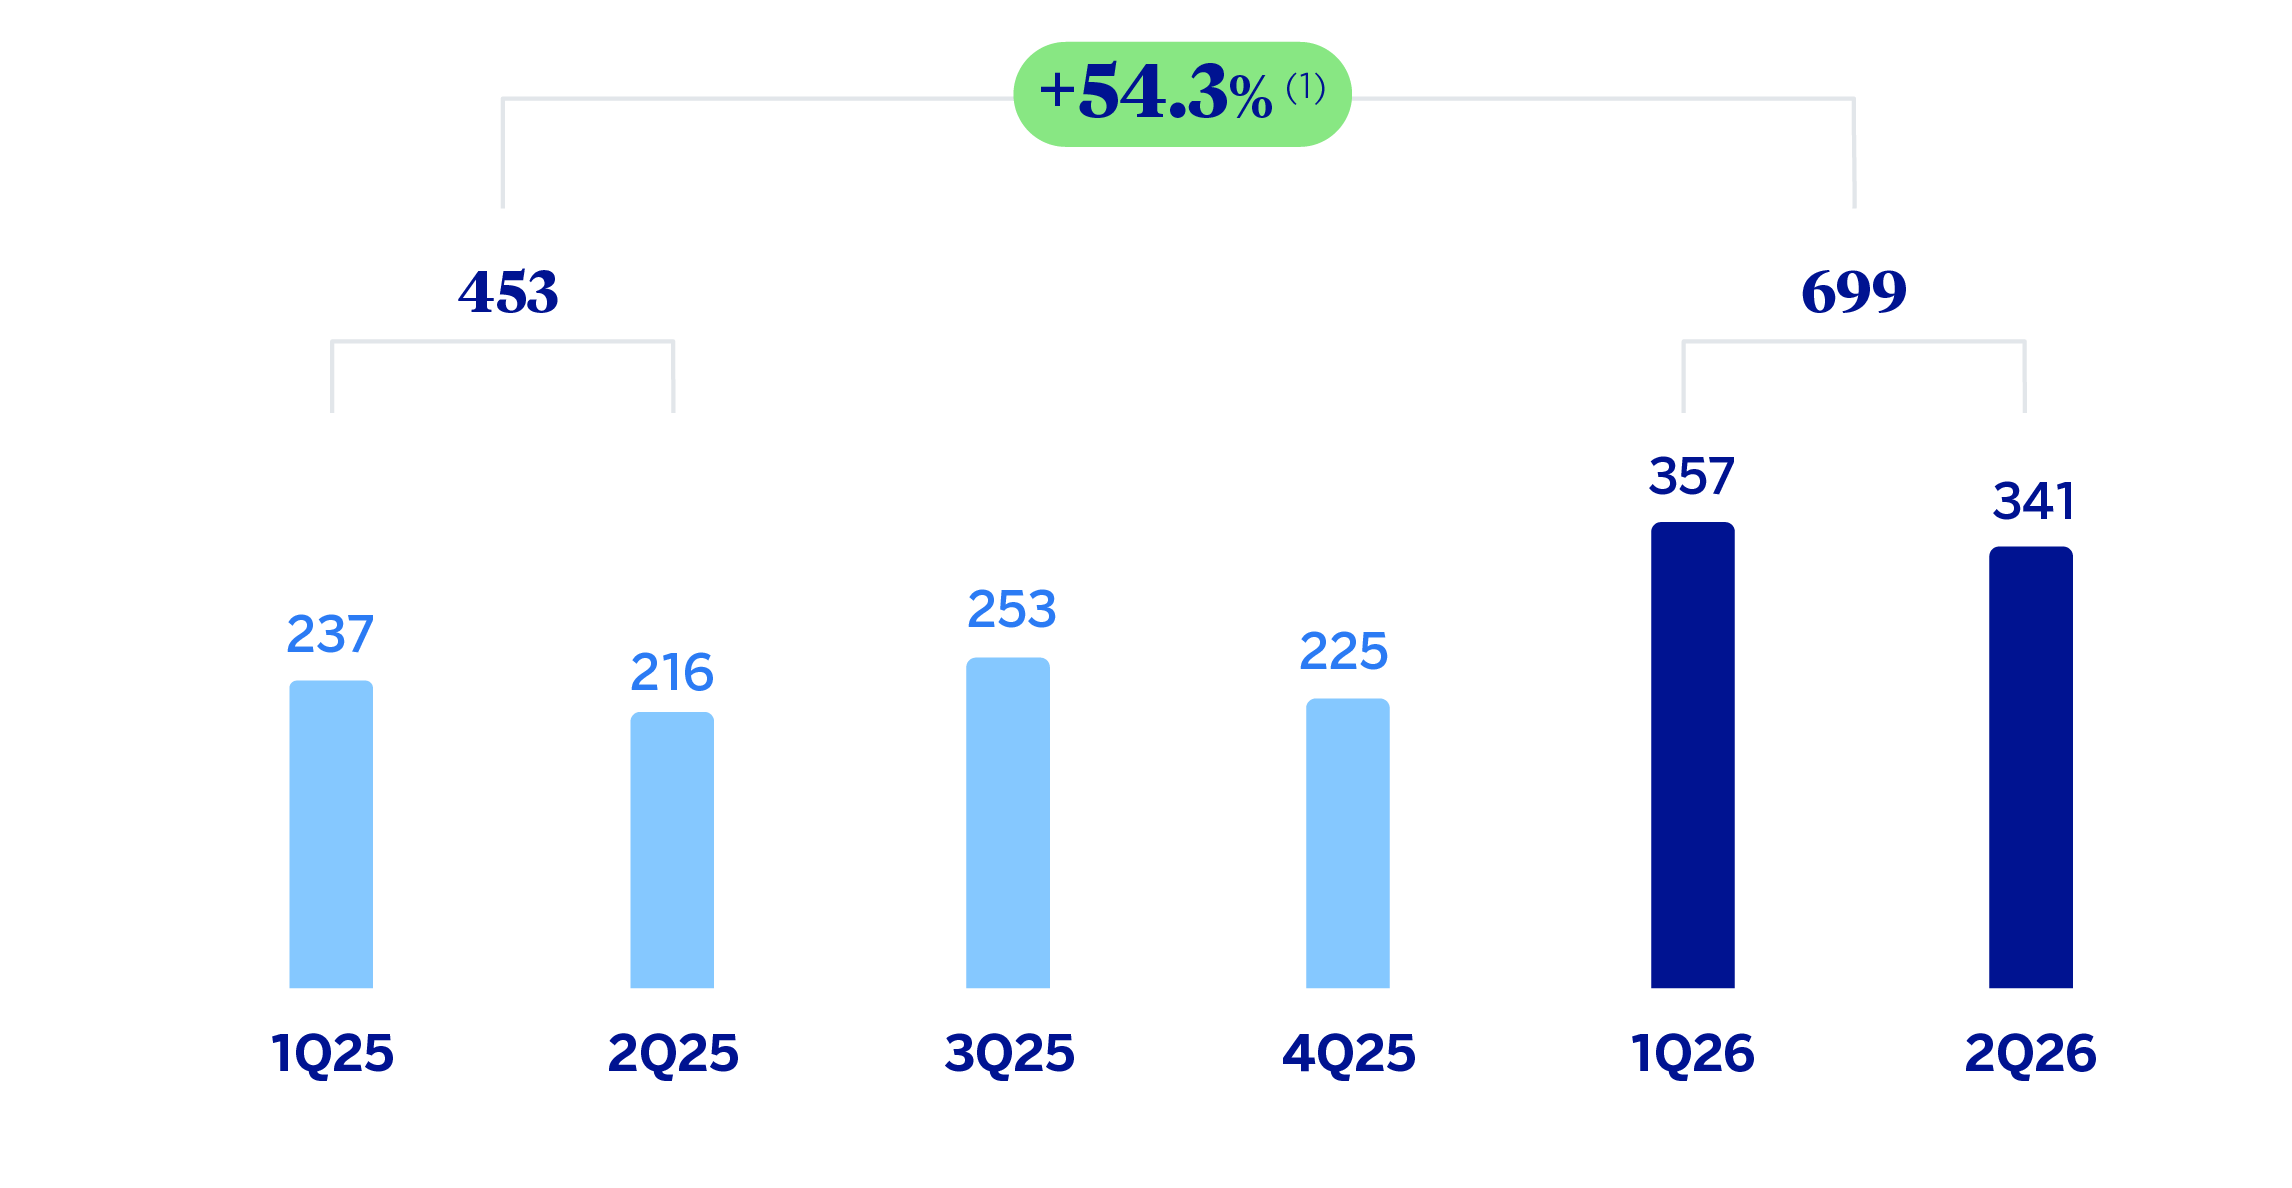
(1) At current exchange rates: +55.9%.
NET ATTRIBUTABLE PROFIT (LOSS)
(MILLIONS OF EUROS AT CONSTANT EXCHANGE RATES)
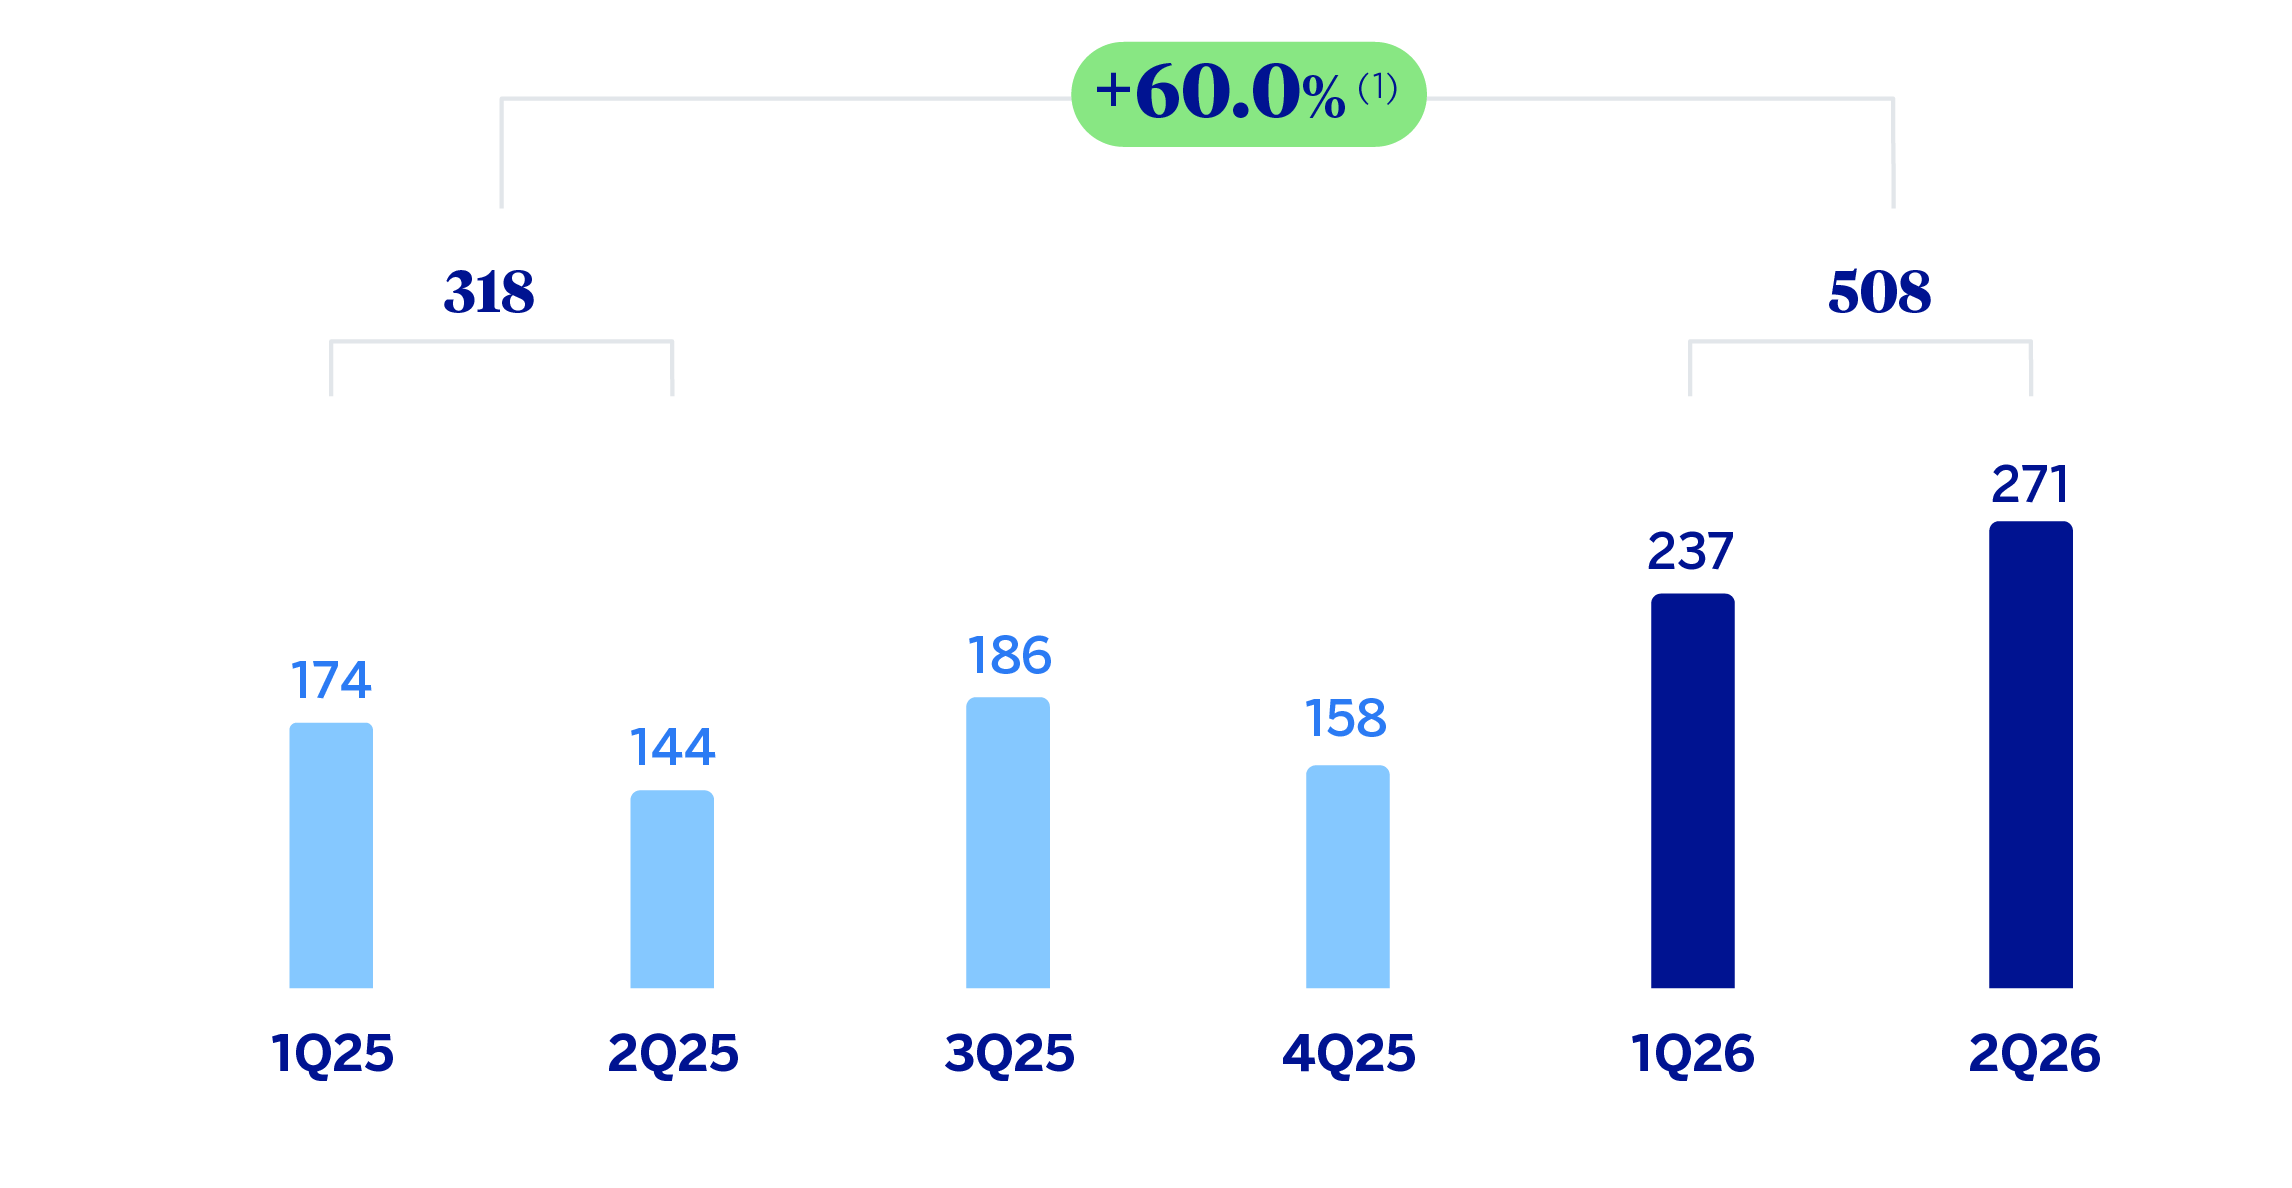
(1) At current exchange rates: +62.0%.
| FINANCIAL STATEMENTS AND RELEVANT BUSINESS INDICATORS (MILLIONS OF EUROS AND PERCENTAGE) | ||||
|---|---|---|---|---|
| Income statement | 6M26 | 𝚫 % | 𝚫 % (1) | 6M25 (2) |
| Net interest income | 507 | 37.5 | 36.0 | 369 |
| Net fees and commissions | 391 | 41.1 | 41.5 | 277 |
| Net trading income | 300 | 66.9 | 66.5 | 180 |
| Other operating income and expenses | (1) | n.s. | n.s. | 1 |
| Gross income | 1,197 | 44.8 | 44.1 | 827 |
| Operating expenses | (498) | 31.6 | 31.9 | (379) |
| Personnel expenses | (257) | 28.4 | 28.5 | (200) |
| Other administrative expenses | (220) | 37.0 | 37.7 | (160) |
| Depreciation | (21) | 18.5 | 18.0 | (18) |
| Operating income | 699 | 55.9 | 54.3 | 448 |
| Impairment on financial assets not measured at fair value through profit or loss | (51) | 39.4 | 39.5 | (37) |
| Provisions or reversal of provisions and other results | 4 | n.s. | n.s. | (2) |
| Profit (loss) before tax | 652 | 59.0 | 57.3 | 410 |
| Income tax | (143) | 49.3 | 48.4 | (96) |
| Profit (loss) for the period | 508 | 62.0 | 60.0 | 314 |
| Non-controlling interests | — | — | — | — |
| Net attributable profit (loss) | 508 | 62.0 | 60.0 | 314 |
| Balance sheets | 30-06-26 | 𝚫 % | 𝚫 % (1) | 31-12-25 (2) |
| Cash, cash balances at central banks and other demand deposits | 16,789 | 45.2 | 41.1 | 11,559 |
| Financial assets designated at fair value | 2,825 | 46.5 | 43.9 | 1,928 |
| Of which: Loans and advances | 2,175 | 60.6 | 57.0 | 1,354 |
| Financial assets at amortized cost | 97,298 | 31.0 | 29.4 | 74,292 |
| Of which: Loans and advances to customers | 86,353 | 30.0 | 28.4 | 66,418 |
| Inter-area positions | — | — | — | — |
| Tangible assets | 256 | (1.9) | (3.9) | 261 |
| Other assets | 848 | 170.2 | 167.5 | 314 |
| Total assets/liabilities and equity | 118,016 | 33.6 | 31.6 | 88,354 |
| Financial liabilities held for trading and designated at fair value through profit or loss | 868 | 13.6 | 10.3 | 764 |
| Deposits from central banks and credit institutions | 7,288 | 40.7 | 39.5 | 5,181 |
| Deposits from customers | 41,027 | 0.2 | (0.7) | 40,932 |
| Debt certificates | 2,177 | 21.0 | 19.1 | 1,800 |
| Inter-area positions (3) | 58,422 | 79.2 | 75.4 | 32,593 |
| Other liabilities (3) | 1,941 | 3.1 | 1.4 | 1,882 |
| Allocated regulatory capital | 6,294 | 21.0 | 19.2 | 5,202 |
| Relevant business indicators | 30-06-26 | 𝚫 % | 𝚫 % (1) | 31-12-25 |
| Performing loans and advances to customers under management (4) | 86,234 | 29.8 | 28.1 | 66,457 |
| Non-performing loans | 392 | 157.1 | 157.1 | 153 |
| Customer deposits under management (4) | 41,027 | 0.2 | (0.7) | 40,932 |
| Off-balance sheet funds (5) | 783 | 6.4 | 6.4 | 736 |
| Risk-weighted assets | 54,505 | 16.3 | 14.6 | 46,853 |
| RORWA (1)(6) | 2.1 | 1.7 | ||
| Efficiency ratio (%) | 41.6 | 49.0 | ||
| NPL ratio (%) | 0.3 | 0.2 | ||
| NPL coverage ratio (%) | 89 | 172 | ||
| Cost of risk (%) | 0.14 | 0.15 | ||
| (1) At constant exchange rate. (2) Revised balances. For more information, please refer to the “Business Areas” section. (3) Revised balances in 2025. (4) Excluding repos. (5) Includes pension funds. (6) For more information on the calculation methodology, as well as the calculation of the metric at the consolidated Group level, see Alternative Performance Measures at this report. |
||||
Unless expressly stated otherwise, all the comments below on rates of change, for both activity and results, will be given at constant exchange rates. These rates, together with the changes at current exchange rates, can be found in the attached tables of the financial statements and relevant business indicators. Comments that refer to Europe exclude Spain.
Activity
The most relevant aspects of the evolution of BBVA Group's Rest of Business activity during the first half of 2026 were:
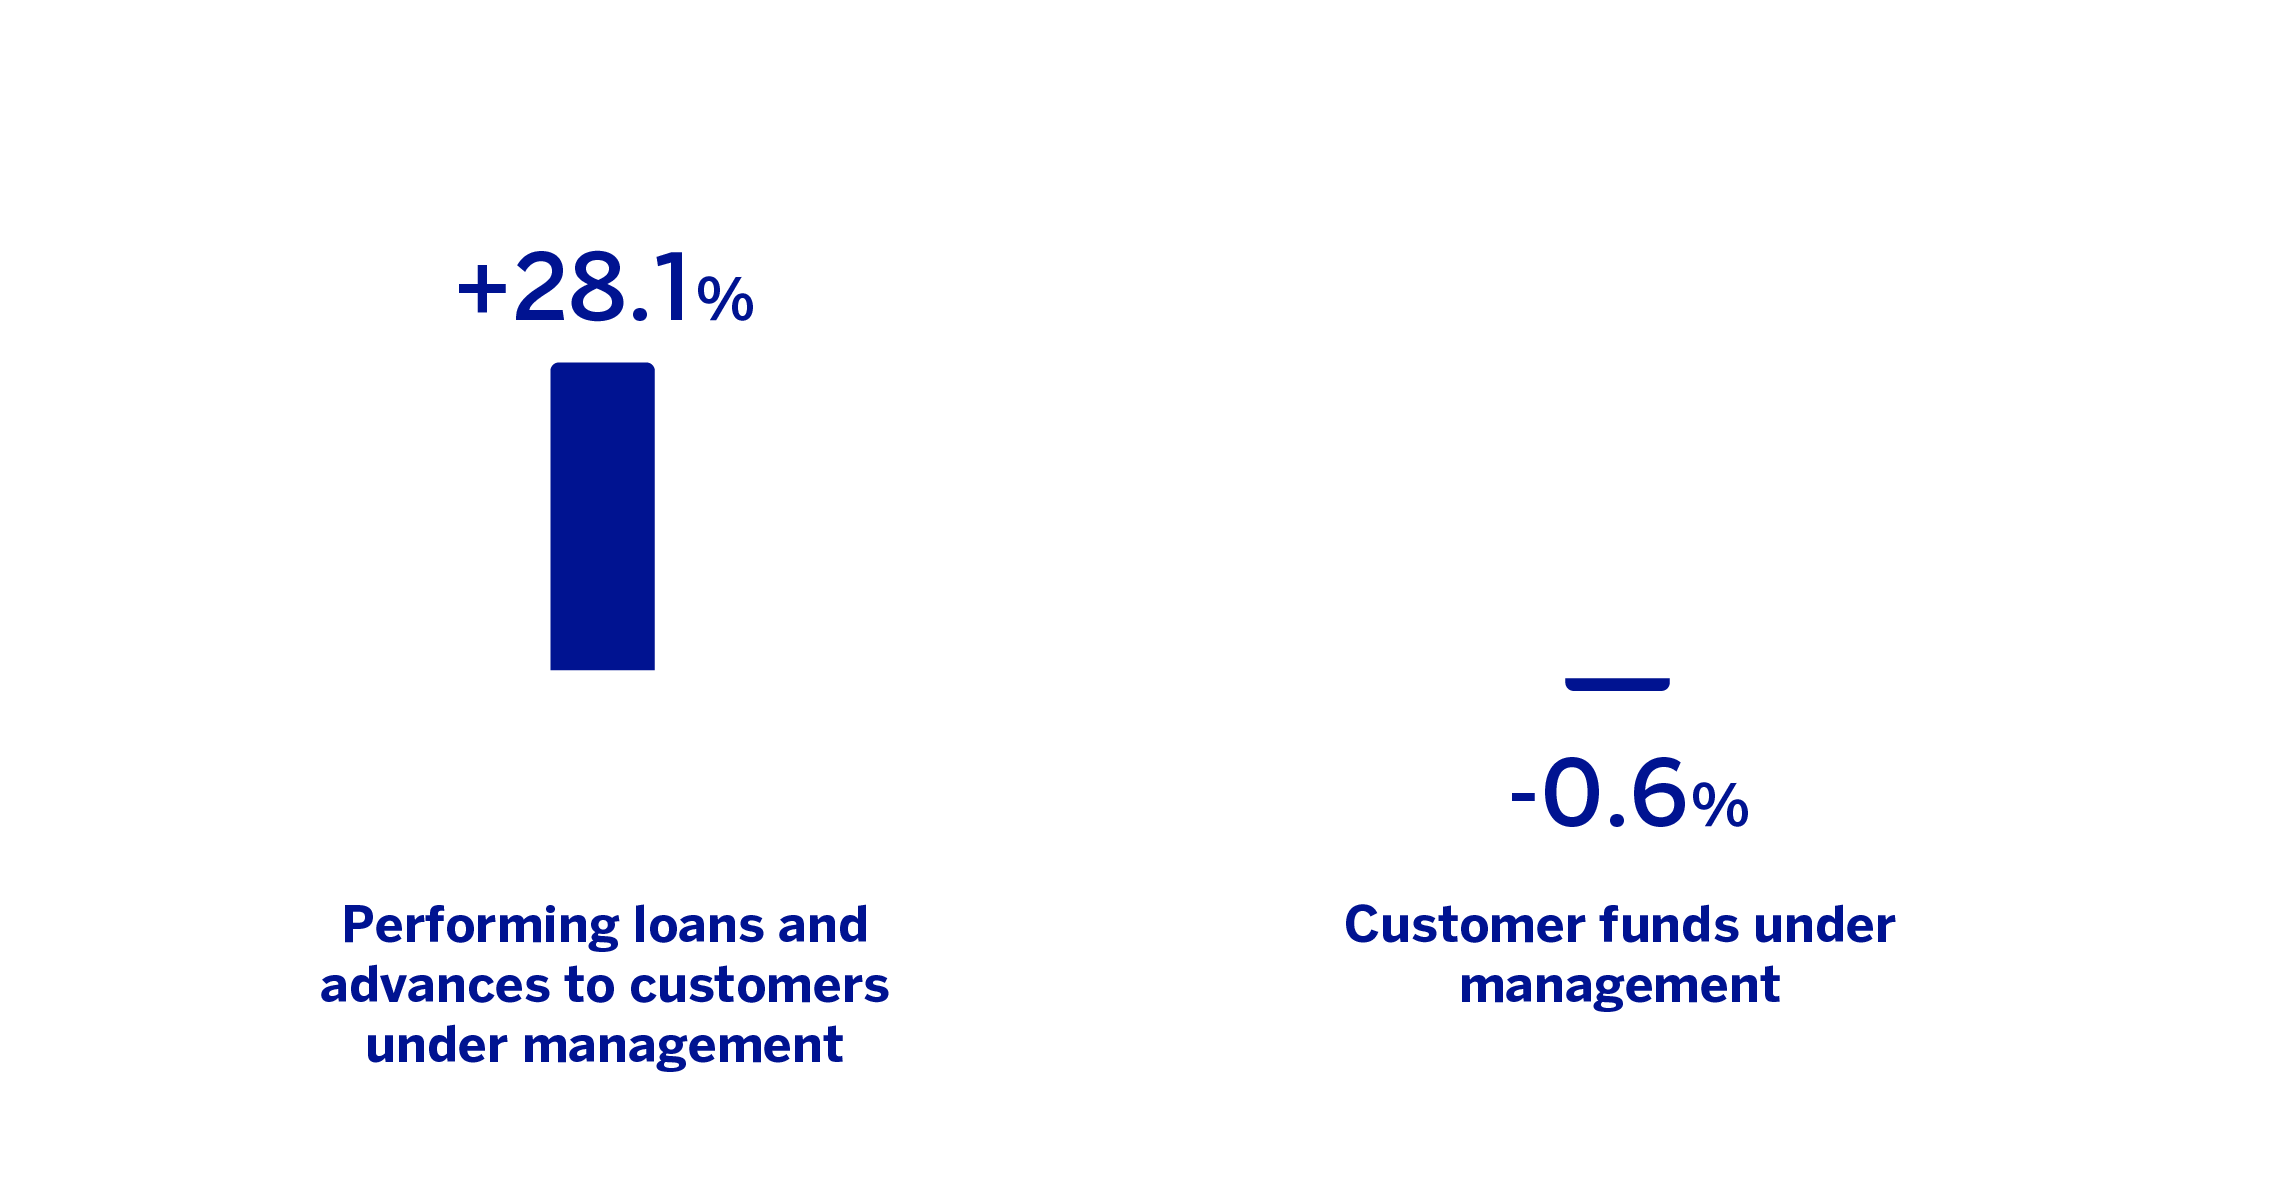
Lending activity (performing loans under management) showed a growth of 28.1%, driven by the dynamism of corporate loans from the New York branch, followed by Asia and Europe.
Customer funds under management remained stable compared to the closing balances at the end of December (-0.6%).
The most relevant aspects of the evolution of BBVA Group's Rest of Business activity during the second quarter of 2026 were:
In the second quarter of 2026, lending activity (performing loans under management) registered a growth of 13.8%, also favored by corporate loans. By geographical areas, growth in the New York branch stood out, followed to a lesser extent by Asia and Europe.
For its part, compared to the end of March, the NPL ratio increased by 18 basis points to stand at 0.3%, while the NPL coverage ratio decreased by 108 percentage points to 89%, which is explained in both cases by the deterioration of two wholesale customers.
Customer funds under management increased by 7.5%, mainly driven by customer deposits in New York and Asia.
Results
Rest of Business achieved a net attributable profit of €508 million in the first half of 2026, 60.0% higher than in the same period of the previous year, favored by the evolution of the recurring revenues and the NTI, which more than offset the increase in operating expenses.
In the year-on-year evolution of the main lines of the area's income statement at the end of June 2026, the following was particularly noteworthy:
Net interest income grew by 36.0% as a result of increased activity volume, particularly in investment banking, as well as transactional business.
Net fees and commissions had an excellent performance and increased by 41.5%, thanks to relevant operations in project finance and corporate loans. By geographical area, fee generation was concentrated in Europe and the United States.
NTI grew by 66.5%, benefiting from the contribution of the United States and, to a lesser extent, Europe and Asia, driven mainly by commercial activity, highlighting the operations in interest rates and equities.
Increase in operating expenses of 31.9% explained by both higher general (technology and services provided by third parties) and personnel expenses, due to new hires. By geographical areas, growth was focused in Europe.
The impairment on financial assets line at the end of June 2026 recorded a balance of €-51 million, a figure which is higher than in the same period of the previous year, mainly originated in higher provisions linked to specific exposures in the United States and Europe. For its part, the cumulative cost of risk at the end of June stood at 0.14%, at similar levels to the end of the previous year.
In the second quarter of 2026, and excluding the effect of the exchange rates fluctuations, the Group's Rest of Businesses as a whole generated a net attributable profit of €271 million, 14.5% higher than the result of the first quarter of 2026, favored by the growth of net interest income and a lower level of loan-loss provisions.
Read legal disclaimer of this report.