


Additional pro forma information: Corporate & Investment Banking
Highlights for the period January - June 2026
- Credit growth with stability in customer deposits
- Positive evolution of recurring revenues
- Strength of gross income in all business divisions
- Increase in net attributable profit
BUSINESS ACTIVITY (1) (VARIATION AT CONSTANT EXCHANGE RATES COMPARED TO 31-12-25)
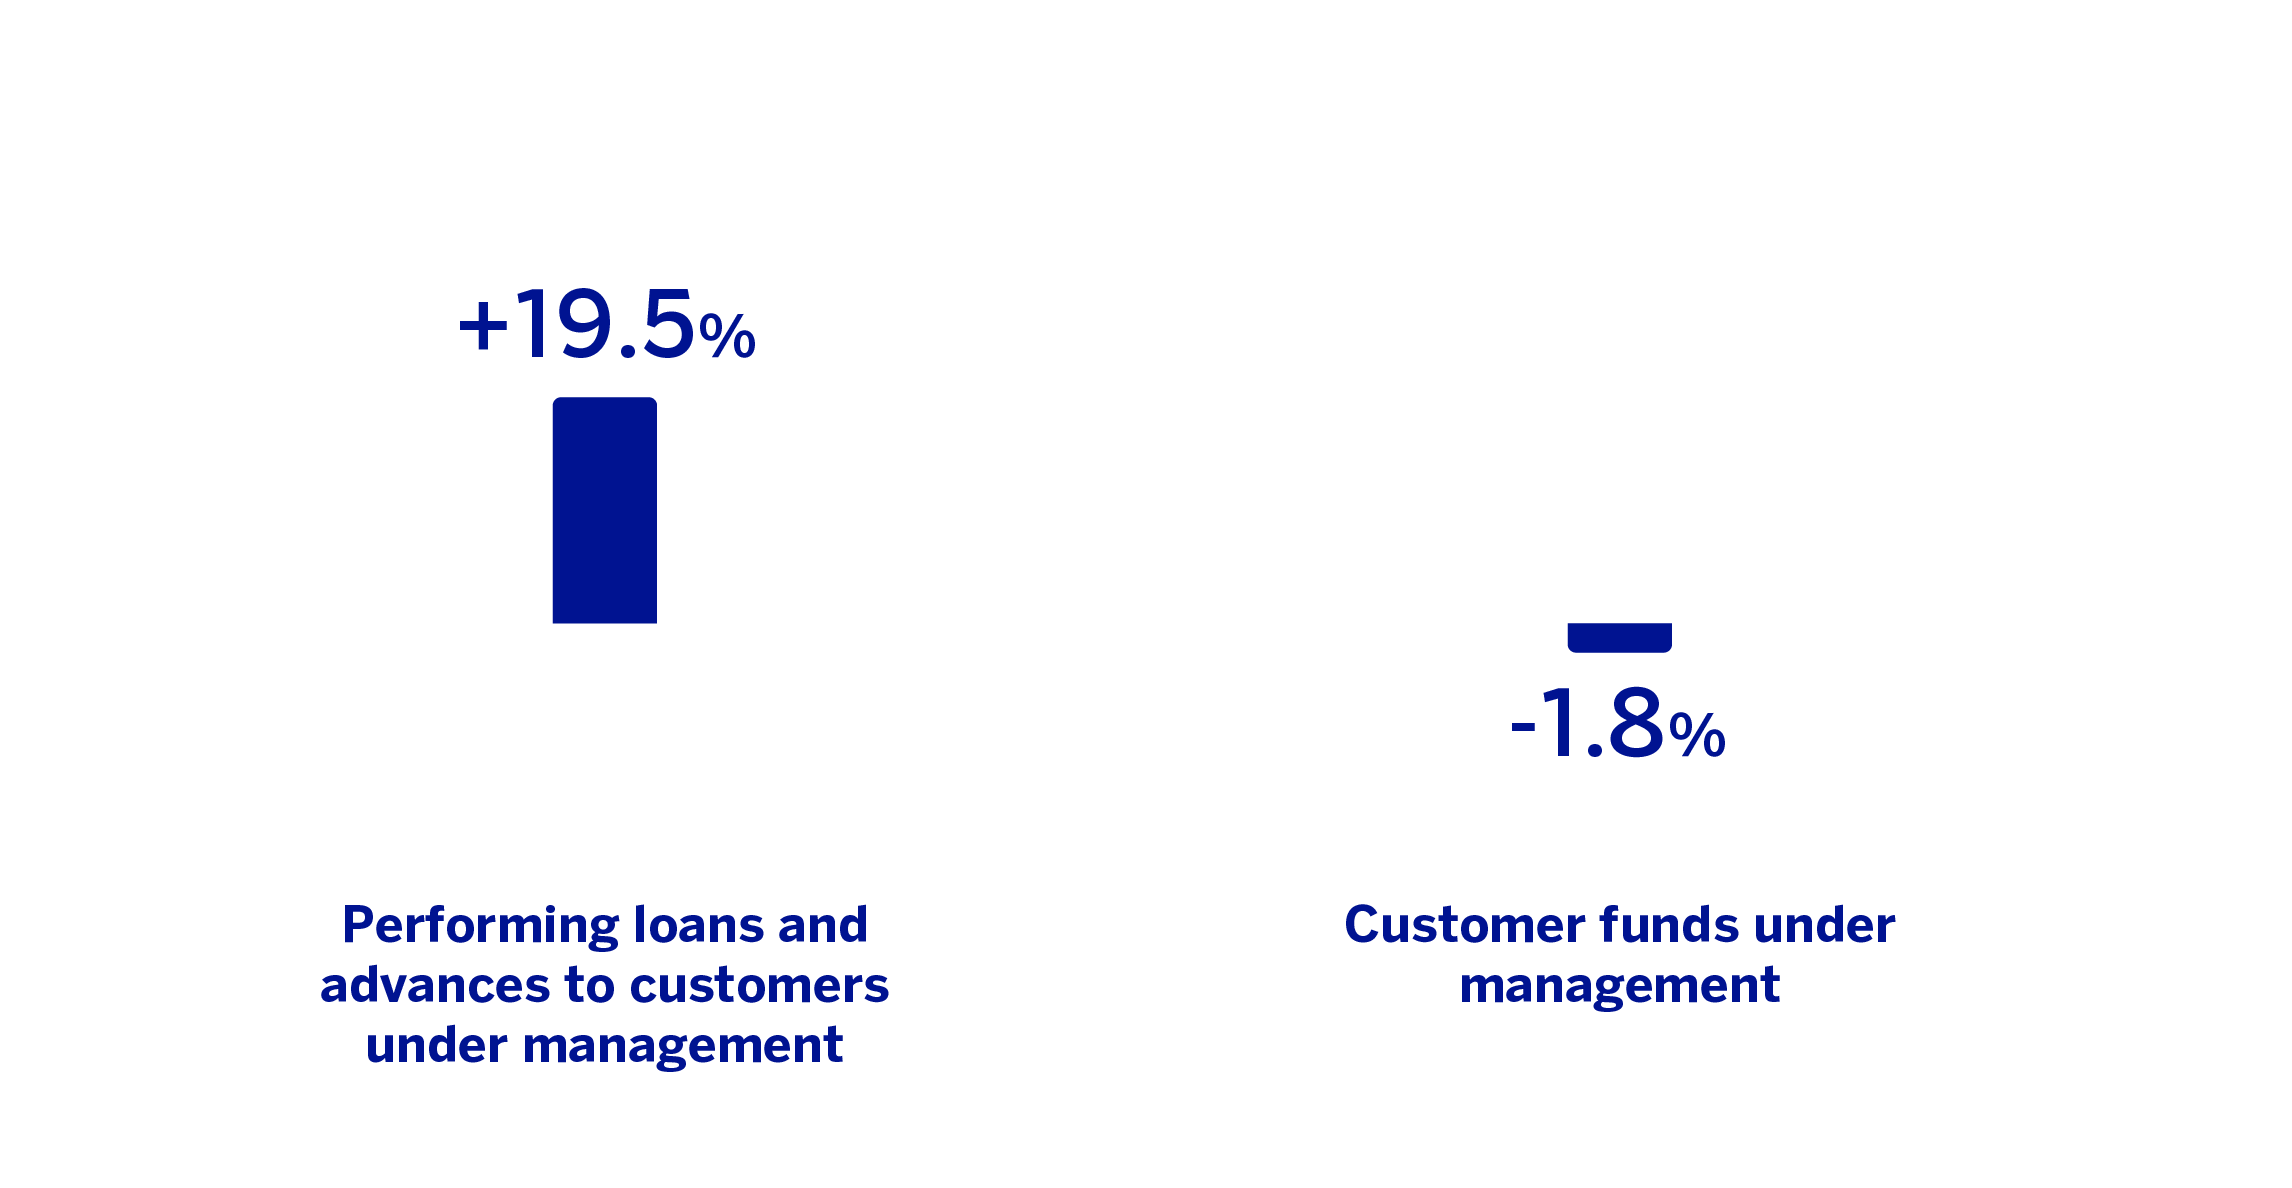
(1) Excluding repos.
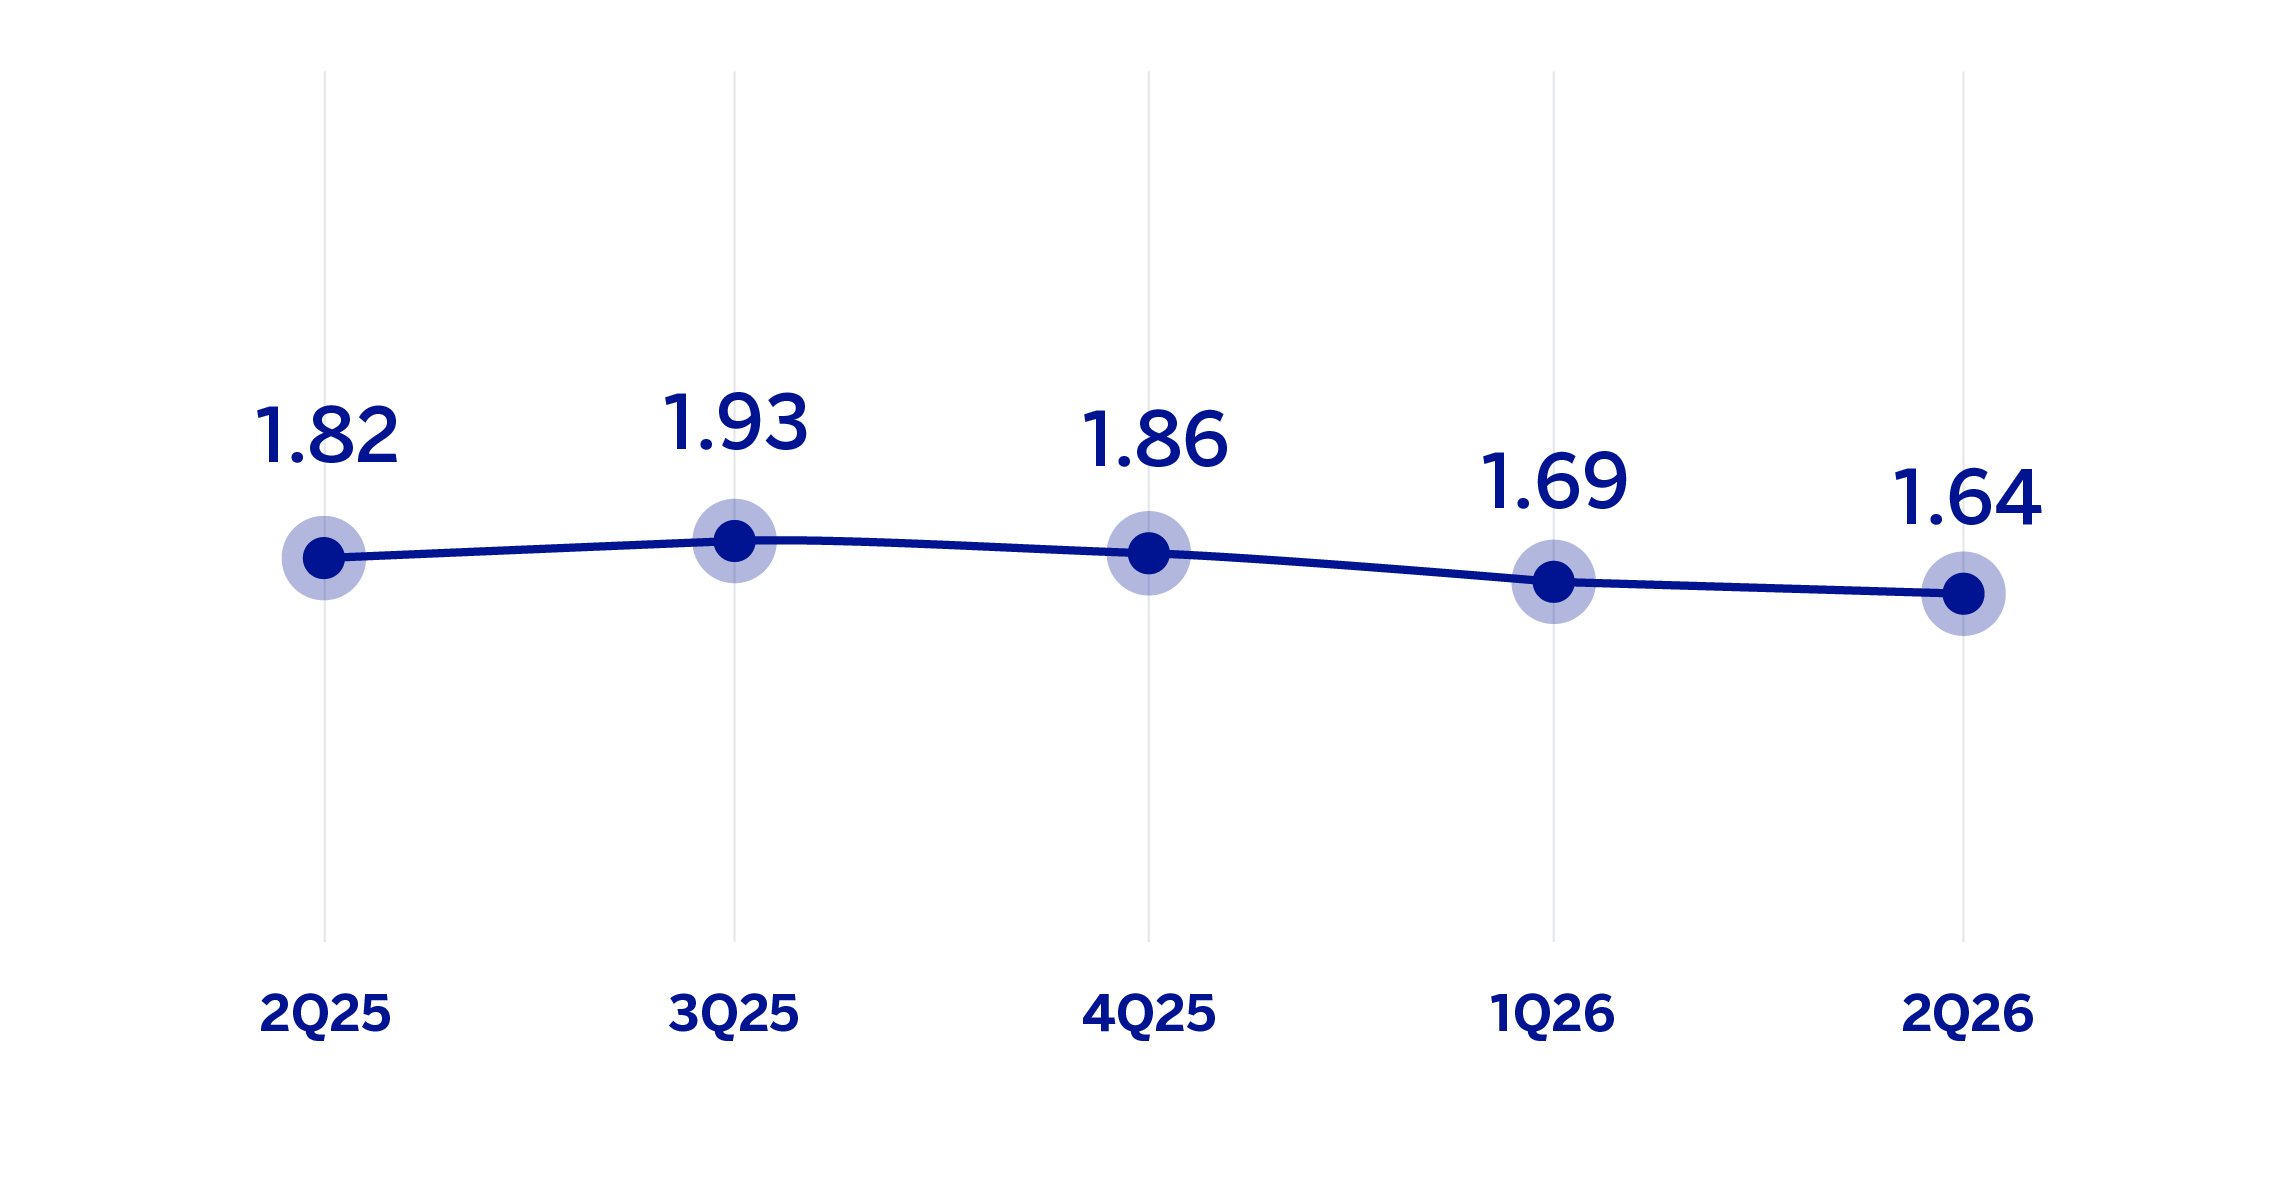
RECURRING REVENUES / AVERAGE TOTAL ASSETS
(PERCENTAGE AT CONSTANT EXCHANGE RATES)
OPERATING INCOME
(MILLIONS OF EUROS AT CONSTANT EXCHANGE RATES)
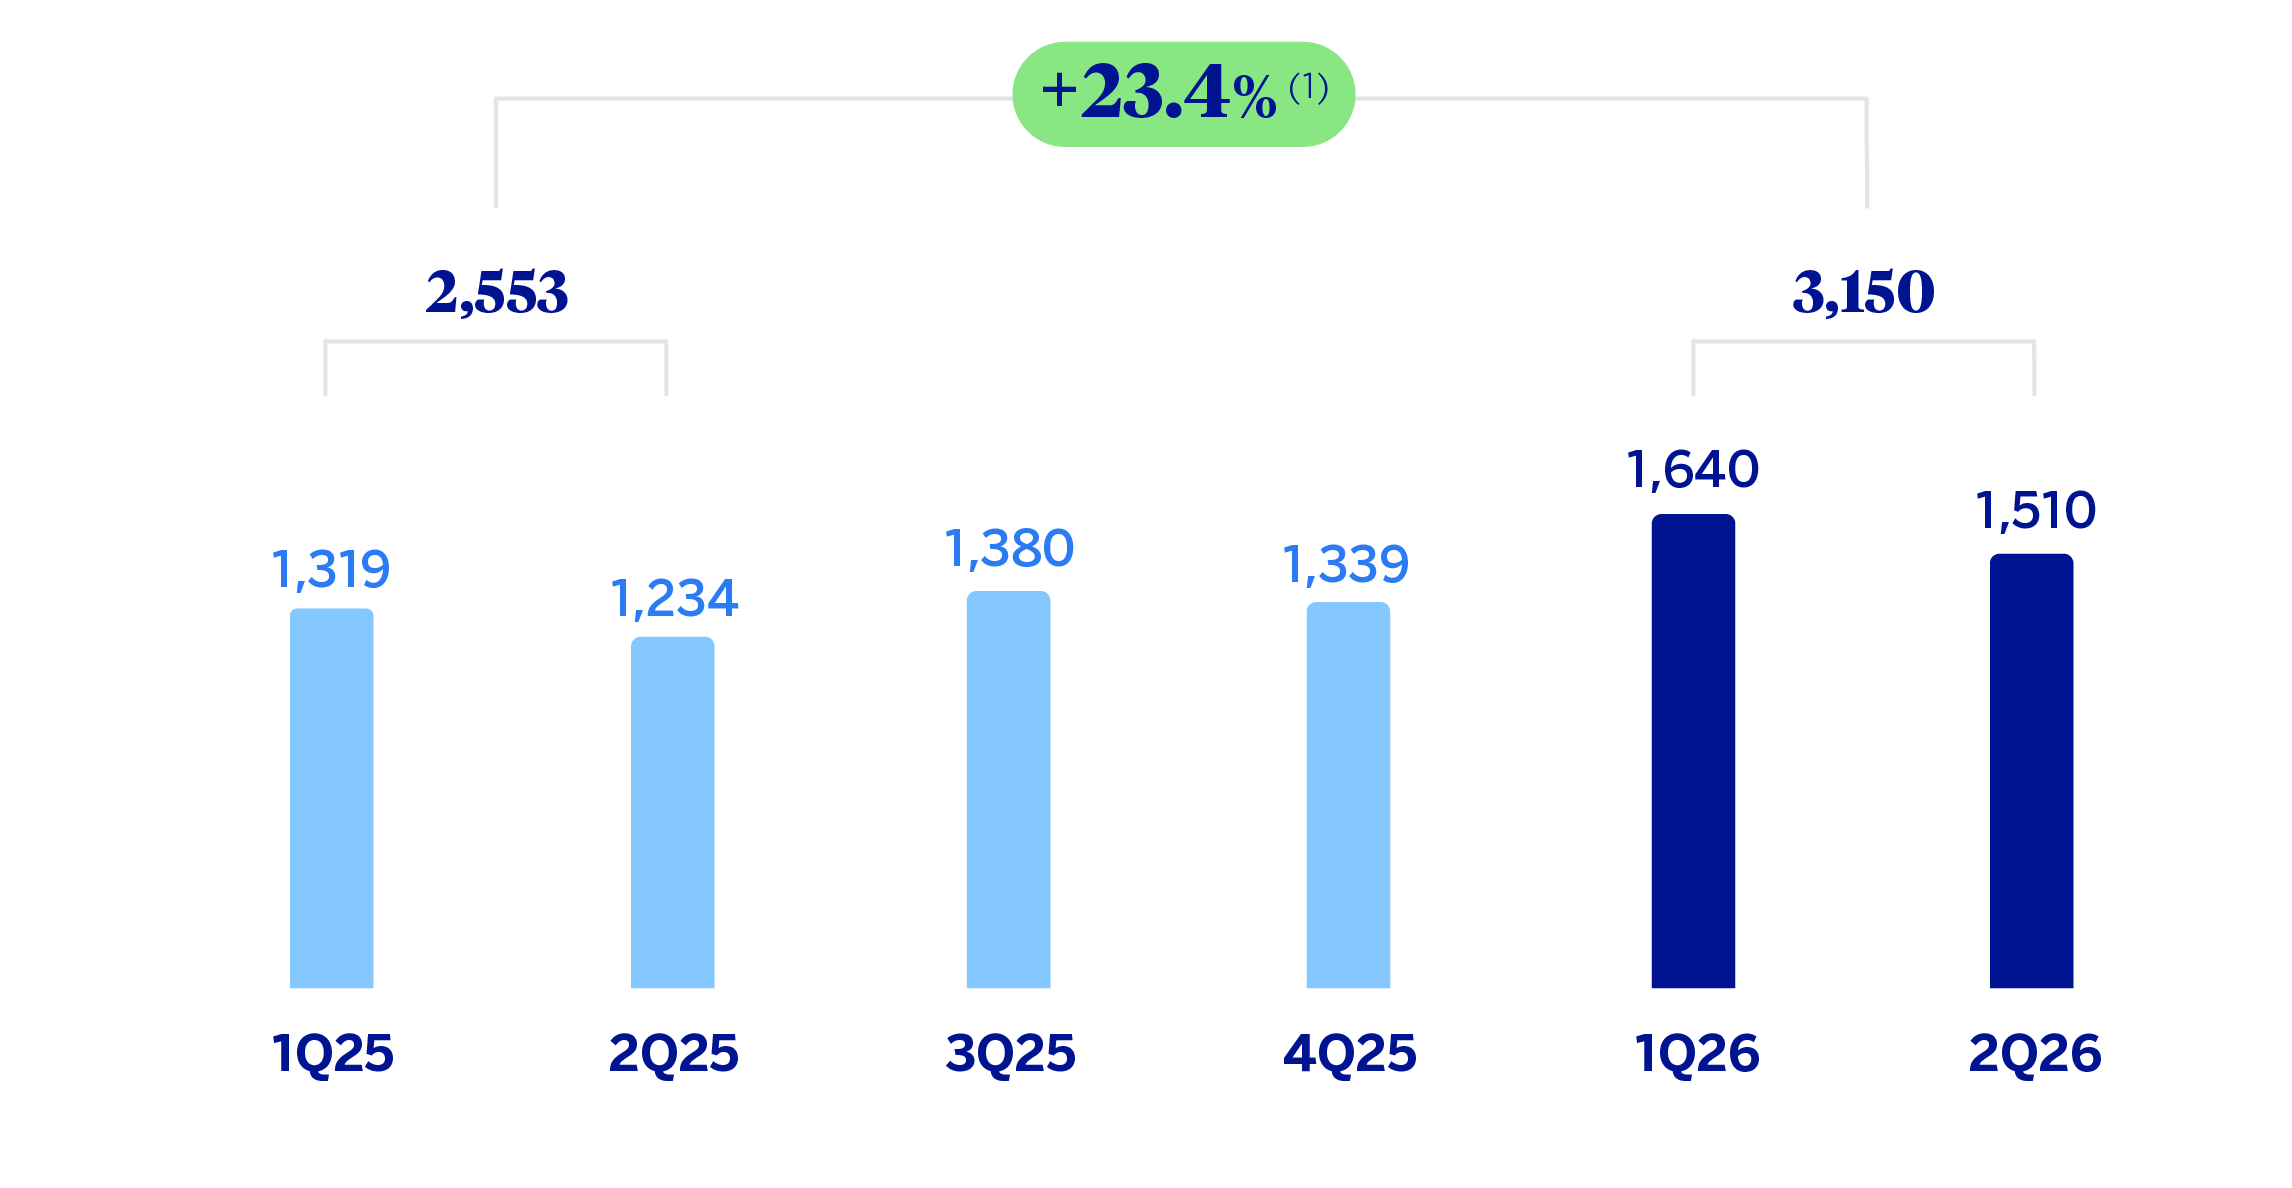
(1) At current exchange rates: +20.5%.
NET ATTRIBUTABLE PROFIT (LOSS)
(MILLIONS OF EUROS AT CONSTANT EXCHANGE RATES)
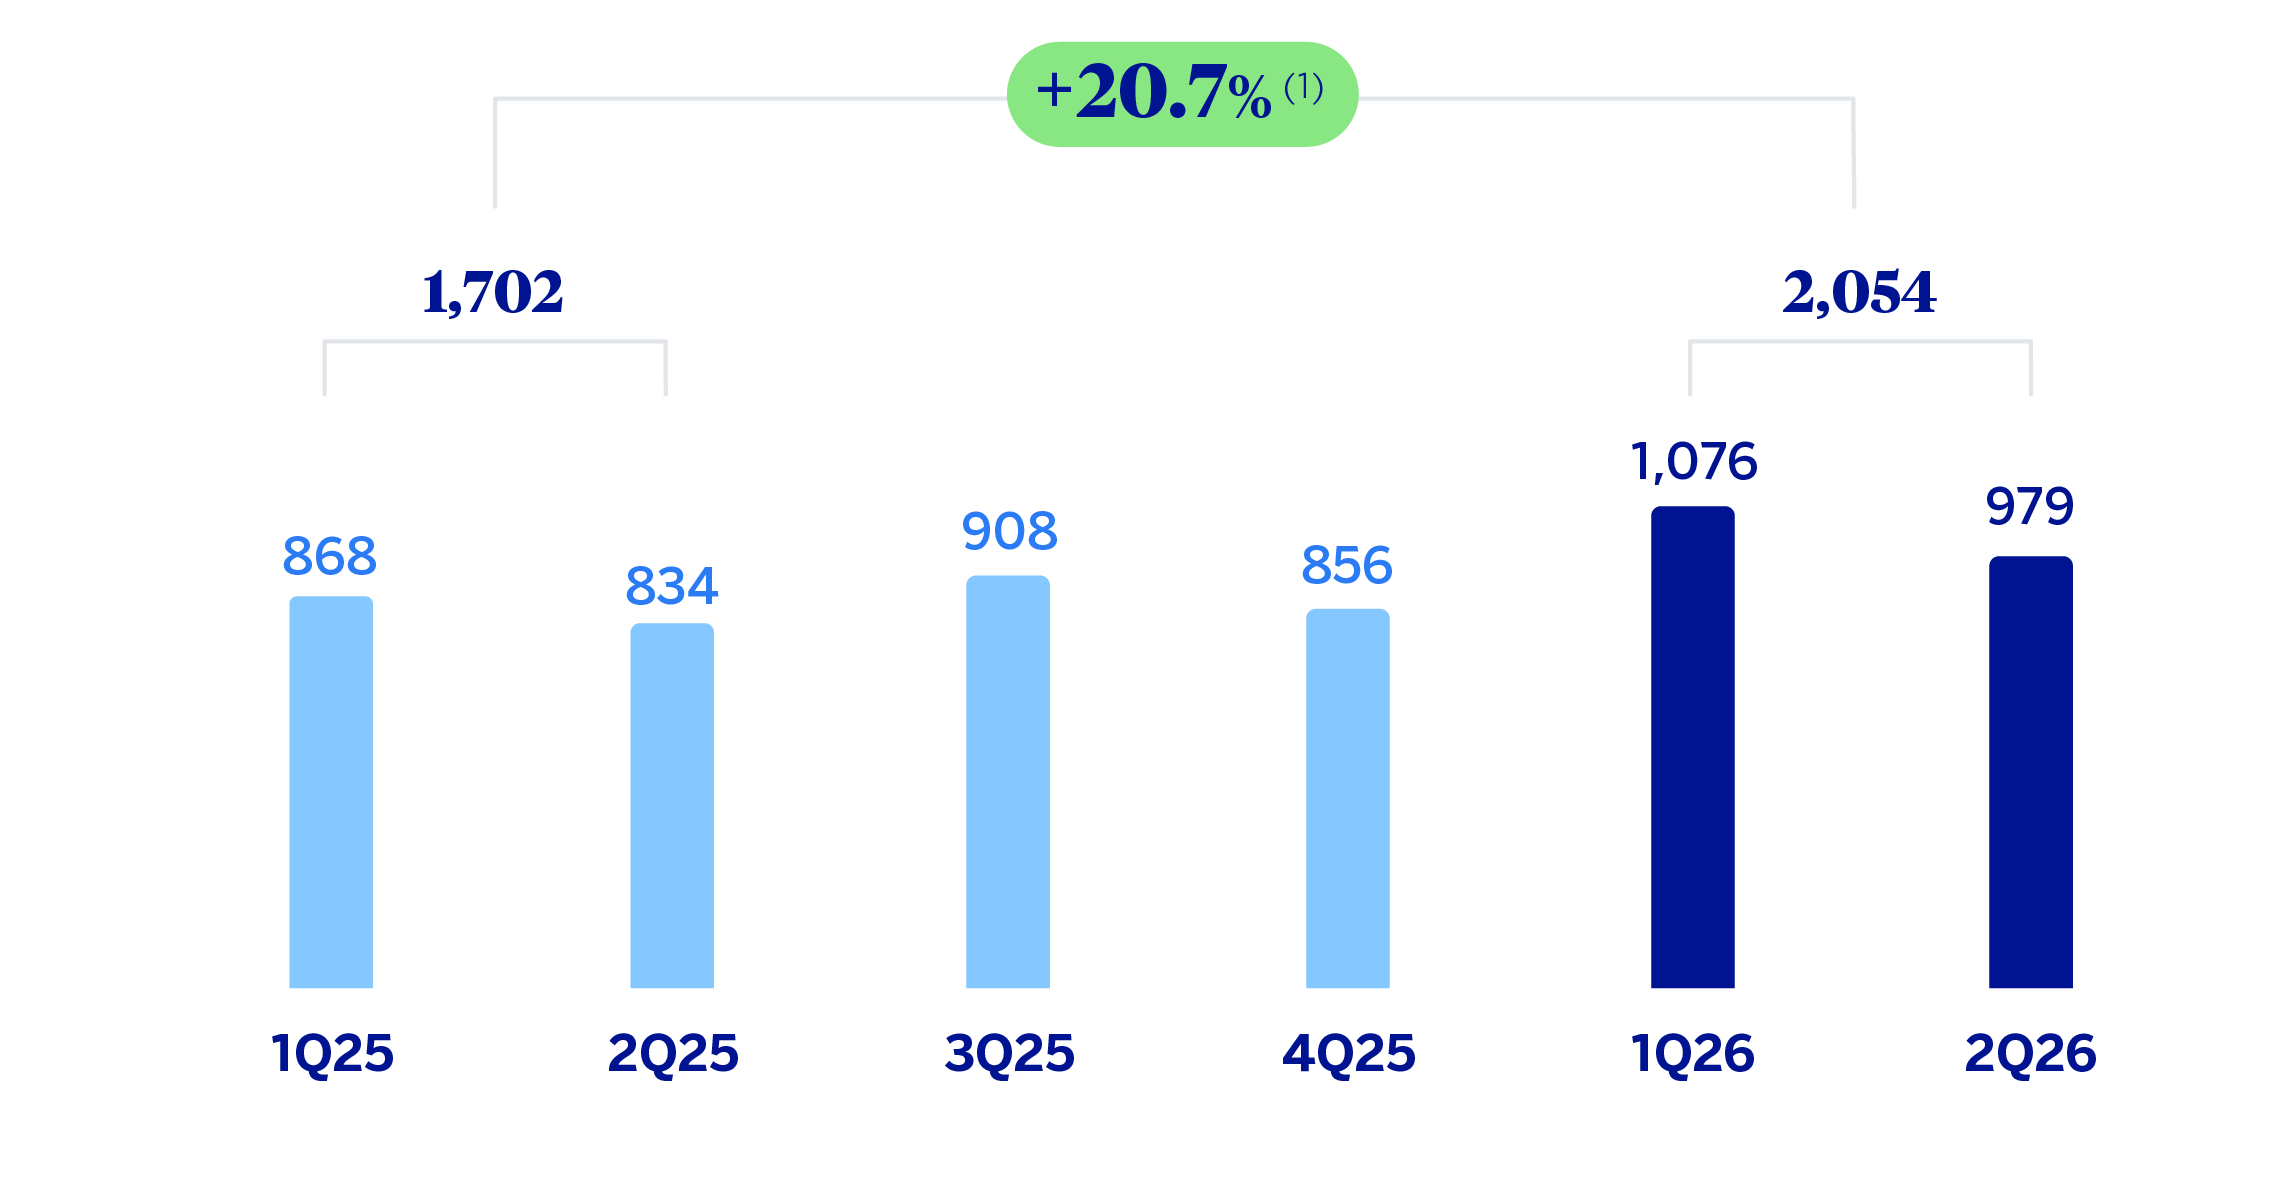
(1) At current exchange rates: +18.2%.
The additional pro forma information from CIB excludes the application of hyperinflation accounting and the Group's wholesale business in Venezuela.
| FINANCIAL STATEMENTS AND RELEVANT BUSINESS INDICATORS (MILLIONS OF EUROS AND PERCENTAGE) | ||||
|---|---|---|---|---|
| Income statement | 6M26 | 𝚫 % | 𝚫 % (1) | 6M25 (2) |
| Net interest income | 2,119 | 23.6 | 26.2 | 1,714 |
| Net fees and commissions | 894 | 27.1 | 26.9 | 704 |
| Net trading income | 1,278 | 15.8 | 18.4 | 1,103 |
| Other operating income and expenses | (40) | 64.3 | 60.8 | (24) |
| Gross income | 4,251 | 21.6 | 23.7 | 3,497 |
| Operating expenses | (1,101) | 24.7 | 24.5 | (883) |
| Personnel expenses | (521) | 20.8 | 21.2 | (431) |
| Other administrative expenses | (501) | 28.6 | 27.8 | (390) |
| Depreciation | (79) | 27.8 | 26.6 | (62) |
| Operating income | 3,150 | 20.5 | 23.4 | 2,614 |
| Impairment on financial assets not measured at fair value through profit or loss | (9) | n.s. | n.s. | 55 |
| Provisions or reversal of provisions and other results | 5 | (55.9) | (56.6) | 11 |
| Profit (loss) before tax | 3,146 | 17.4 | 20.6 | 2,680 |
| Income tax | (902) | 18.3 | 21.8 | (762) |
| Profit (loss) for the period | 2,244 | 17.0 | 20.1 | 1,918 |
| Non-controlling interests | (190) | 5.7 | 14.1 | (180) |
| Net attributable profit (loss) | 2,054 | 18.2 | 20.7 | 1,738 |
| Balance sheets | 30-06-26 | 𝚫 % | 𝚫 % (1) | 31-12-25 (2) |
| Cash, cash balances at central banks and other demand deposits | 16,952 | 12.2 | 9.6 | 15,106 |
| Financial assets designated at fair value | 168,612 | 29.1 | 27.5 | 130,559 |
| Of which: Loans and advances | 66,595 | 47.2 | 46.9 | 45,254 |
| Financial assets at amortized cost | 184,537 | 19.3 | 17.5 | 154,718 |
| Of which: Loans and advances to customers | 153,599 | 18.6 | 16.8 | 129,459 |
| Inter-area positions | — | — | — | — |
| Tangible assets | 265 | (1.6) | (3.8) | 269 |
| Other assets | 3,886 | 6.8 | 4.8 | 3,640 |
| Total assets/liabilities and equity | 374,252 | 23.0 | 21.2 | 304,292 |
| Financial liabilities held for trading and designated at fair value through profit or loss | 127,800 | 30.7 | 29.5 | 97,798 |
| Deposits from central banks and credit institutions | 47,614 | 14.0 | 13.2 | 41,780 |
| Deposits from customers | 106,121 | 0.3 | (1.0) | 105,751 |
| Debt certificates | 17,287 | 25.6 | 24.4 | 13,766 |
| Inter-area positions | 52,722 | 91.5 | 80.9 | 27,535 |
| Other liabilities | 7,153 | 104.9 | 107.4 | 3,490 |
| Allocated regulatory capital | 15,557 | 9.8 | 8.0 | 14,171 |
| Relevant business indicators | 30-06-26 | 𝚫 % | 𝚫 % (1) | 31-12-25 (2) |
| Performing loans and advances to customers under management (3) | 153,374 | 21.3 | 19.5 | 126,424 |
| Non-performing loans | 878 | 45.1 | 50.0 | 605 |
| Customer deposits under management (3) | 99,918 | 1.4 | 0.3 | 98,567 |
| Off-balance sheet funds (4) | 2,438 | (44.5) | (47.6) | 4,394 |
| Risk-weighted assets | 127,771 | 7.0 | 5.3 | 119,382 |
| RORWA (5) | 3.7 | 3.4 | ||
| Efficiency ratio (%) | 25.9 | 26.9 | ||
| General note: For the translation of the income statement in those countries where hyperinflation accounting is applied, the punctual exchange rate as of June 30, 2026. (1) At constant exchange rates. (2) Revised balances. For more information, please refer to the “Business Areas” section. (3) Excluding repos. (4) Includes mutual funds, customer portfolios and other off-balance sheet funds. (5) For more information on the calculation methodology, as well as the calculation of the metric at the consolidated Group level, see Alternative Performance Measures at this report. |
||||
Unless expressly stated otherwise, all the comments below on rates of change, for both activity and results, will be given at constant exchange rates. For the conversion of these figures in those countries in which accounting for hyperinflation is applied, the end of period exchange rate as of June 30, 2026 is used. These rates, together with changes at current exchange rates, can be found in the attached tables of financial statements and relevant business indicators. When making comments referring to Europe in this area, Spain is excluded.
Activity
The most relevant aspects related to the area's activity in the first half of 2026 were:
Lending activity in the Group's wholesale businesses recorded a solid performance, with balances growing by 19.5% over the end of 2025. This dynamism was driven by the United States, Europe and Asia (Rest of Business) highlighting the activity in project finance and corporate lending.
Customer funds decreased by 1.8% in the first half, mainly due to the evolution of off-balance sheet funds in Mexico.
The most relevant aspects related to the area's activity in the second quarter of 2026 were:
Lending stood at the end of June 2026, 9.4% above the balance at March 31, 2026, continuing the upward trend of recent quarters. Growth was observed in both transactional banking and Investment Banking & Finance (IB&F), driven primarily by the performance of the countries compromising the Rest of Business area, particularly the United States and Asia.
Customer funds grew by 4.0% during the second quarter of 2026, mainly in Rest of Business.
Results
CIB generated a net attributable profit of €2,054 million in the first six months of 202617. Excluding the impact of currency fluctuations, this result represents a 20.7% increase over the previous year, which reflects again the strength of the Group's wholesale businesses, with the aim of offering a value proposition focused on the needs of its customers.
All business divisions posted double-digit revenue growth: Global Markets with good behavior in all its products, particularly in interest rates and equities; Global Transaction Banking (GTB), thanks to the positive evolution of recurring revenues, mainly net interest income; excellent results in IB&F, with relevant operations that have generated commission income and a positive evolution of net interest income. All business divisions showed growth in net attributable profit to shareholders.
The evolution of this aggregate is largely explained by the performance of the Group's wholesale businesses in the United States, Europe (excluding Spain) and Asia. The most relevant aspects of the year-on-year income statement evolution as of the end of June 2026 are summarized below:
Net interest income increased by 26.2%, thanks to the continued growth of the portfolio both in 2025 and in the first half of 2026, in both GTB and IB&F.
Net fees and commissions recorded an increase of 26.9%, mainly driven by the strong performance of Project Finance and Corporate Lending in IB&F as well as by the guarantee activity associated with Working Capital and Trade Finance in GTB.
Growth in the NTI line (+18.4%) was driven by commercial activity, with significant performance in interest rates, credit and equities.
Operating expenses grew by 24.5% driven by higher personnel expenses, associated with strategic plans and new capacities, together with the impact of the voluntary redundancies in the first quarter of 2026, and higher general expenses (mainly in technology).
The impairment on financial assets line recorded a provision of €-9 million, which contrasts with the releases of the first half of 2025, mainly originated in Turkey.
In the second quarter of 2026 and excluding the effect of the variation in exchange rates, the Groups wholesale businesses generated a net attributable profit of €979m, which represents a decrease of 9.0% compared to the previous quarter. This evolution is mainly impacted by lower net fees and commissions and NTI, which were very high in the previous quarter.
17 The additional pro forma information from CIB excludes the application of hyperinflation accounting and the Group's wholesale business in Venezuela.
Read legal disclaimer of this report.