


South America
Highlights for the period January - June 2026
- Growth in lending activity and customer funds
- Favorable evolution of recurring revenues in Argentina, Colombia and Peru
- Greater adjustment for hyperinflation compared to the first half of 2025
- Year-on-year increase in the area's net attributable profit, with a standout performance in Colombia
BUSINESS ACTIVITY (1) (VARIATION AT CONSTANT EXCHANGE RATES COMPARED TO 31-12-25)
(1) Excluding repos.
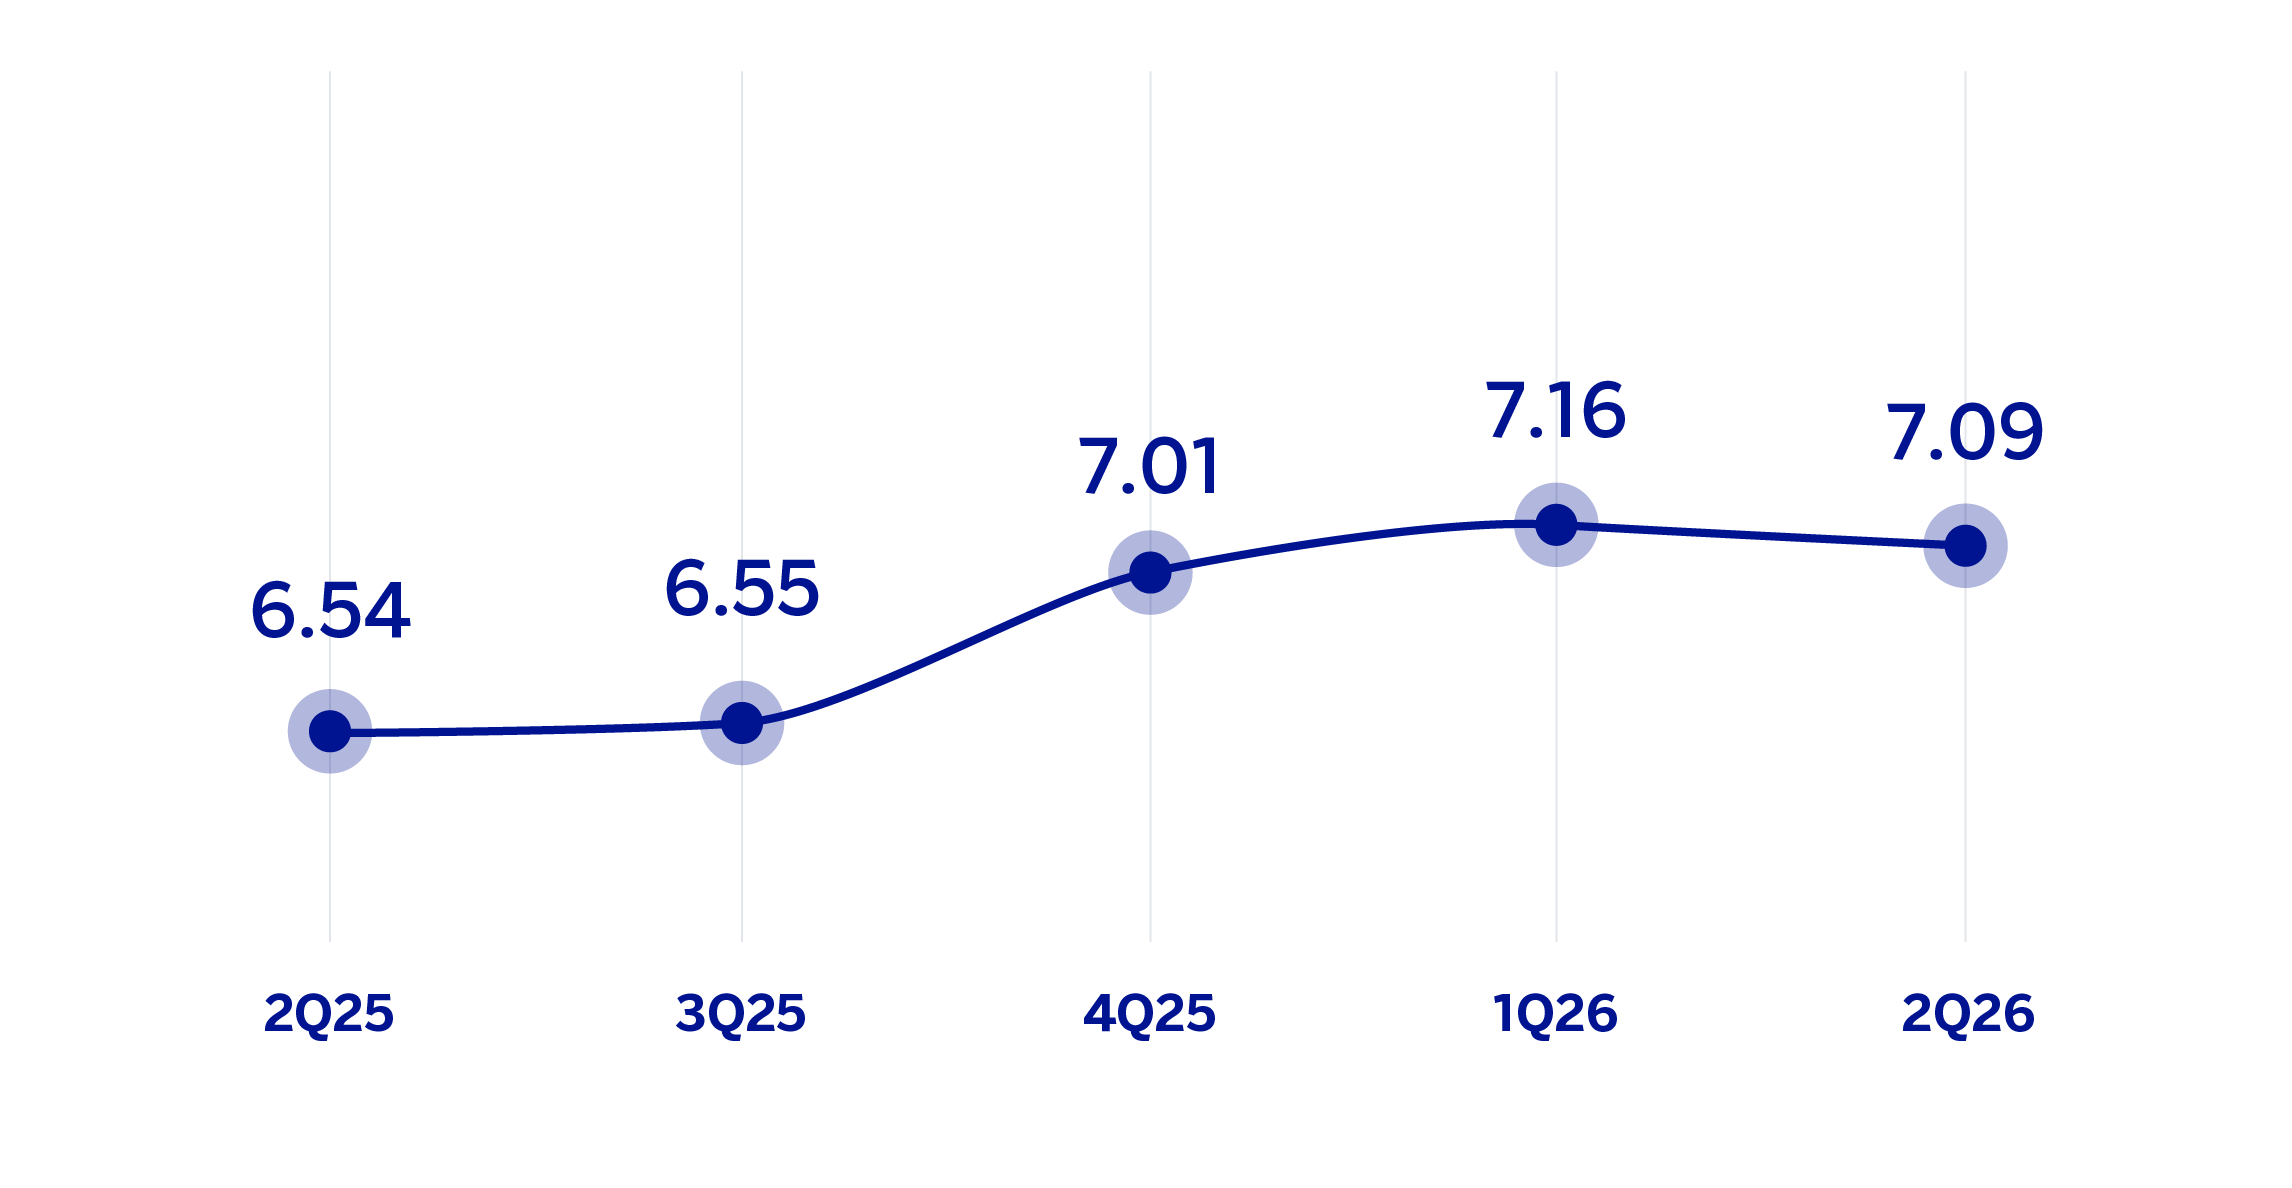
NET INTEREST INCOME / AVERAGE TOTAL ASSETS
(PERCENTAGE AT CONSTANT EXCHANGE RATES)
OPERATING INCOME
(MILLIONS OF EUROS AT CURRENT EXCHANGE RATES)
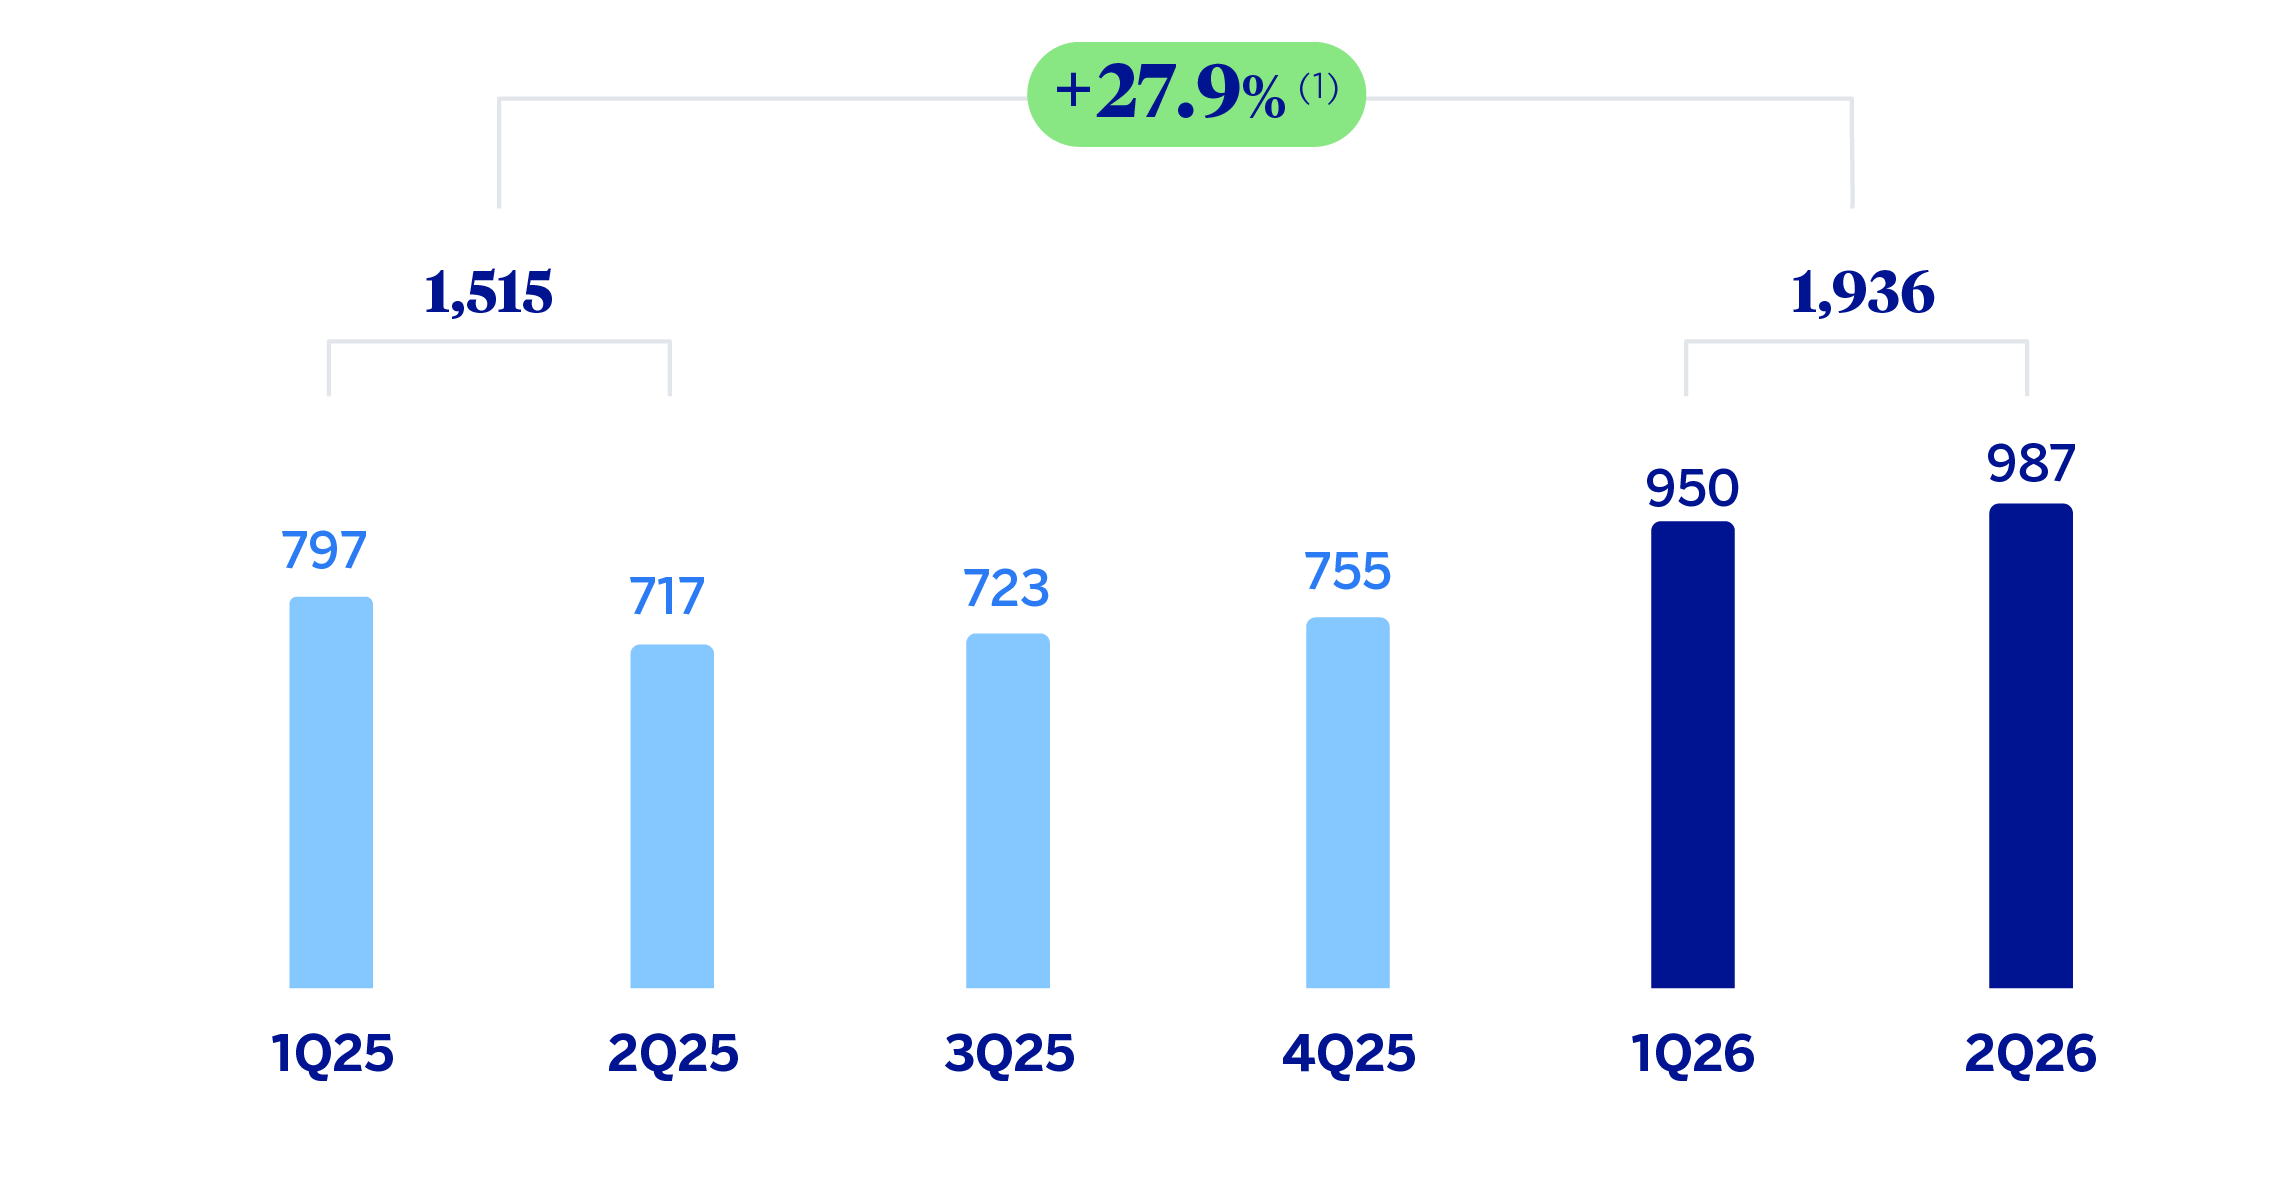
(1) At constant exchange rates: +33.5%.
NET ATTRIBUTABLE PROFIT (LOSS)
(MILLIONS OF EUROS AT CURRENT EXCHANGE RATES)
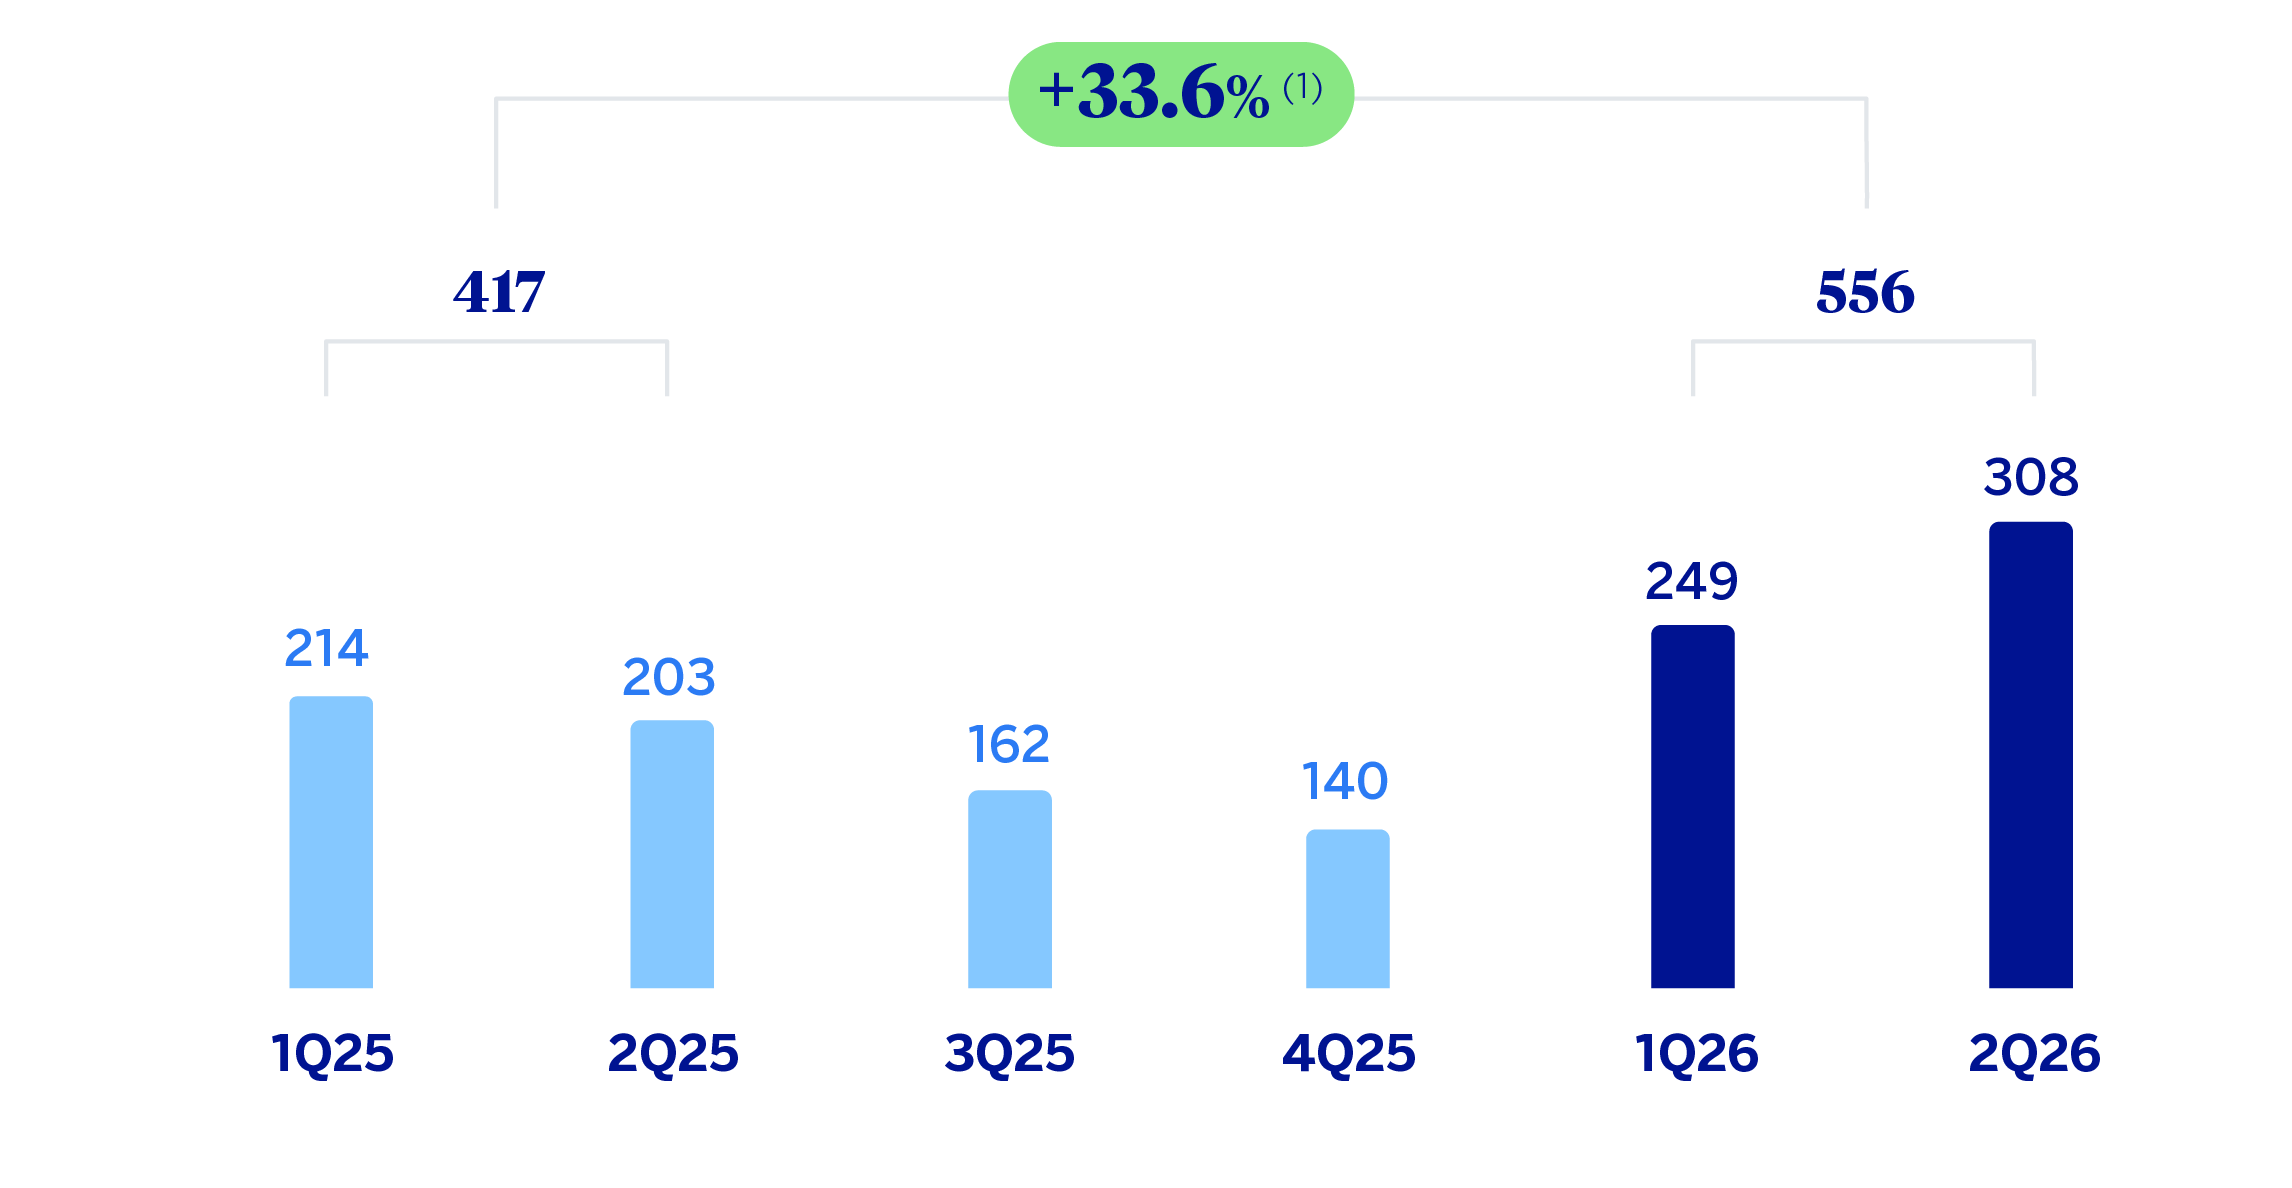
(1) At constant exchange rates: +41.6%.
| FINANCIAL STATEMENTS AND RELEVANT BUSINESS INDICATORS (MILLIONS OF EUROS AND PERCENTAGE) | ||||
|---|---|---|---|---|
| Income statement | 6M26 | 𝚫 % | 𝚫 % (1) | 6M25 (2) |
| Net interest income | 2,952 | 23.7 | 28.6 | 2,387 |
| Net fees and commissions | 544 | 30.3 | 36.7 | 417 |
| Net trading income | 310 | (2.9) | 2.8 | 319 |
| Other operating income and expenses | (498) | 23.3 | 30.1 | (404) |
| Gross income | 3,308 | 21.6 | 26.7 | 2,719 |
| Operating expenses | (1,371) | 13.8 | 18.2 | (1,205) |
| Personnel expenses | (641) | 20.1 | 25.5 | (534) |
| Other administrative expenses | (614) | 8.7 | 13.0 | (565) |
| Depreciation | (117) | 9.5 | 9.4 | (106) |
| Operating income | 1,936 | 27.9 | 33.5 | 1,515 |
| Impairment on financial assets not measured at fair value through profit or loss | (745) | 41.0 | 42.0 | (528) |
| Provisions or reversal of provisions and other results | (2) | (85.4) | (82.6) | (16) |
| Profit (loss) before tax | 1,189 | 22.5 | 30.3 | 970 |
| Income tax | (330) | 13.2 | 21.7 | (291) |
| Profit (loss) for the period | 859 | 26.5 | 33.9 | 679 |
| Non-controlling interests | (303) | 15.3 | 21.8 | (263) |
| Net attributable profit (loss) | 556 | 33.6 | 41.6 | 417 |
| Balance sheets | 30-06-26 | 𝚫 % | 𝚫 % (1) | 31-12-25 (2) |
| Cash, cash balances at central banks and other demand deposits | 8,666 | 7.3 | 3.5 | 8,073 |
| Financial assets designated at fair value | 13,609 | 28.4 | 21.6 | 10,602 |
| Of which: Loans and advances | 280 | (5.8) | (16.3) | 297 |
| Financial assets at amortized cost | 60,510 | 11.5 | 5.9 | 54,283 |
| Of which: Loans and advances to customers | 57,663 | 12.5 | 6.9 | 51,235 |
| Tangible assets | 1,270 | 10.6 | 8.7 | 1,149 |
| Other assets | 2,416 | (4.0) | (10.6) | 2,517 |
| Total assets/liabilities and equity | 86,471 | 12.9 | 7.3 | 76,624 |
| Financial liabilities held for trading and designated at fair value through profit or loss | 3,025 | 24.5 | 11.8 | 2,430 |
| Deposits from central banks and credit institutions | 3,673 | (4.0) | (7.1) | 3,826 |
| Deposits from customers | 60,780 | 13.9 | 8.1 | 53,375 |
| Debt certificates | 4,210 | 4.9 | 0.3 | 4,015 |
| Other liabilities | 7,088 | 24.2 | 20.8 | 5,707 |
| Allocated regulatory capital | 7,694 | 5.8 | 0.6 | 7,271 |
| Relevant business indicators | 30-06-26 | 𝚫 % | 𝚫 % (1) | 31-12-25 |
| Performing loans and advances to customers under management (3) | 56,873 | 12.5 | 6.9 | 50,566 |
| Non-performing loans | 2,564 | 10.8 | 5.2 | 2,314 |
| Customer deposits under management (4) | 60,780 | 13.9 | 8.1 | 53,375 |
| Off-balance sheet funds (5) | 9,864 | 19.3 | 13.0 | 8,271 |
| Risk-weighted assets | 62,487 | 11.8 | 6.2 | 55,912 |
| RORWA (6) | 2.9 | 2.1 | ||
| Efficiency ratio (%) | 41.5 | 44.4 | ||
| NPL ratio (%) | 4.0 | 4.0 | ||
| NPL coverage ratio (%) | 89 | 92 | ||
| Cost of risk (%) | 2.69 | 2.50 | ||
| (1) At constant exchange rate. (2) Revised balances. For more information, please refer to the “Business Areas” section. (3) Excluding repos. (4) Excluding repos and including specific marketable debt securities. (5) Includes mutual funds and customer portfolios in Peru and Colombia, with the latter being preliminary as of June 30, 2026. (6) For more information on the calculation methodology, as well as the calculation of the metric at the consolidated Group level, see Alternative Performance Measures at this report. |
||||
| SOUTH AMERICA. DATA PER COUNTRY (MILLIONS OF EUROS) | |||||||||
|---|---|---|---|---|---|---|---|---|---|
| Country | Operating income | Net attributable profit (loss) | |||||||
| 6M26 | 𝚫 % | 𝚫 % (1) | 6M25 | 6M26 | 𝚫 % | 𝚫 % (1) | 6M25 | ||
| Argentina | 526 | 46.8 | n.s. | 359 | 73 | (19.2) | n.s. | 91 | |
| Colombia | 437 | 43.3 | 33.2 | 305 | 175 | 140.4 | 123.5 | 73 | |
| Peru | 673 | 12.1 | 10.8 | 601 | 194 | 25.3 | 23.9 | 155 | |
| Other countries (2) | 300 | 19.8 | 19.8 | 251 | 114 | 15.9 | 15.8 | 98 | |
| Total | 1,936 | 27.9 | 33.5 | 1,515 | 556 | 33.6 | 41.6 | 417 | |
| (1) At constant exchange rates. (2) Chile (Forum), Uruguay, Venezuela and Brazil. Additionally, it includes eliminations and other charges. |
|||||||||
| SOUTH AMERICA. RELEVANT BUSINESS INDICATORS PER COUNTRY (MILLIONS OF EUROS) | ||||||||
|---|---|---|---|---|---|---|---|---|
| Argentina | Colombia | Peru | ||||||
| 30-06-26 | 31-12-25 | 30-06-26 | 31-12-25 | 30-06-26 | 31-12-25 | |||
| Performing loans and advances to customers under management (1)(2) | 9,463 | 8,293 | 20,514 | 19,515 | 21,218 | 20,097 | ||
| Non-performing loans (1) | 665 | 435 | 819 | 894 | 867 | 927 | ||
| Customer deposits under management (1)(3) | 11,419 | 10,254 | 22,483 | 20,943 | 22,342 | 21,148 | ||
| Off-balance sheet funds (1)(4) | 2,847 | 2,119 | 3,507 | 3,359 | 3,508 | 3,250 | ||
| Risk-weighted assets | 12,133 | 10,501 | 22,134 | 19,171 | 21,051 | 19,856 | ||
| RORWA (5) | 1.9 | 1.8 | 1.8 | 0.8 | 3.9 | 3.1 | ||
| Efficiency ratio (%) | 46.8 | 51.5 | 41.9 | 46.3 | 38.0 | 38.9 | ||
| NPL ratio (%) | 6.4 | 4.9 | 3.7 | 4.3 | 3.3 | 3.7 | ||
| NPL coverage ratio (%) | 76 | 84 | 85 | 88 | 105 | 99 | ||
| Cost of risk (%) | 7.70 | 5.67 | 2.02 | 2.19 | 1.25 | 1.67 | ||
| (1) Figures at constant exchange rates. (2) Excluding repos. (3) Excluding repos and including specific marketable debt securities. (4) Includes mutual funds and customer portfolios (in Peru and Colombia, with the latter being preliminary as of June 30, 2026). (5) For more information on the calculation methodology, as well as the calculation of the metric at the consolidated Group level, see Alternative Performance Measures at this report. |
||||||||
Unless expressly stated otherwise, all the comments below on rates of change, for both activity and results, will be given at constant exchange rates. These rates, together with the changes at current exchange rates, can be found in the attached tables of the financial statements and relevant business indicators.
Activity and results
The most relevant aspects related to the area's activity during the first half of 2026 were:
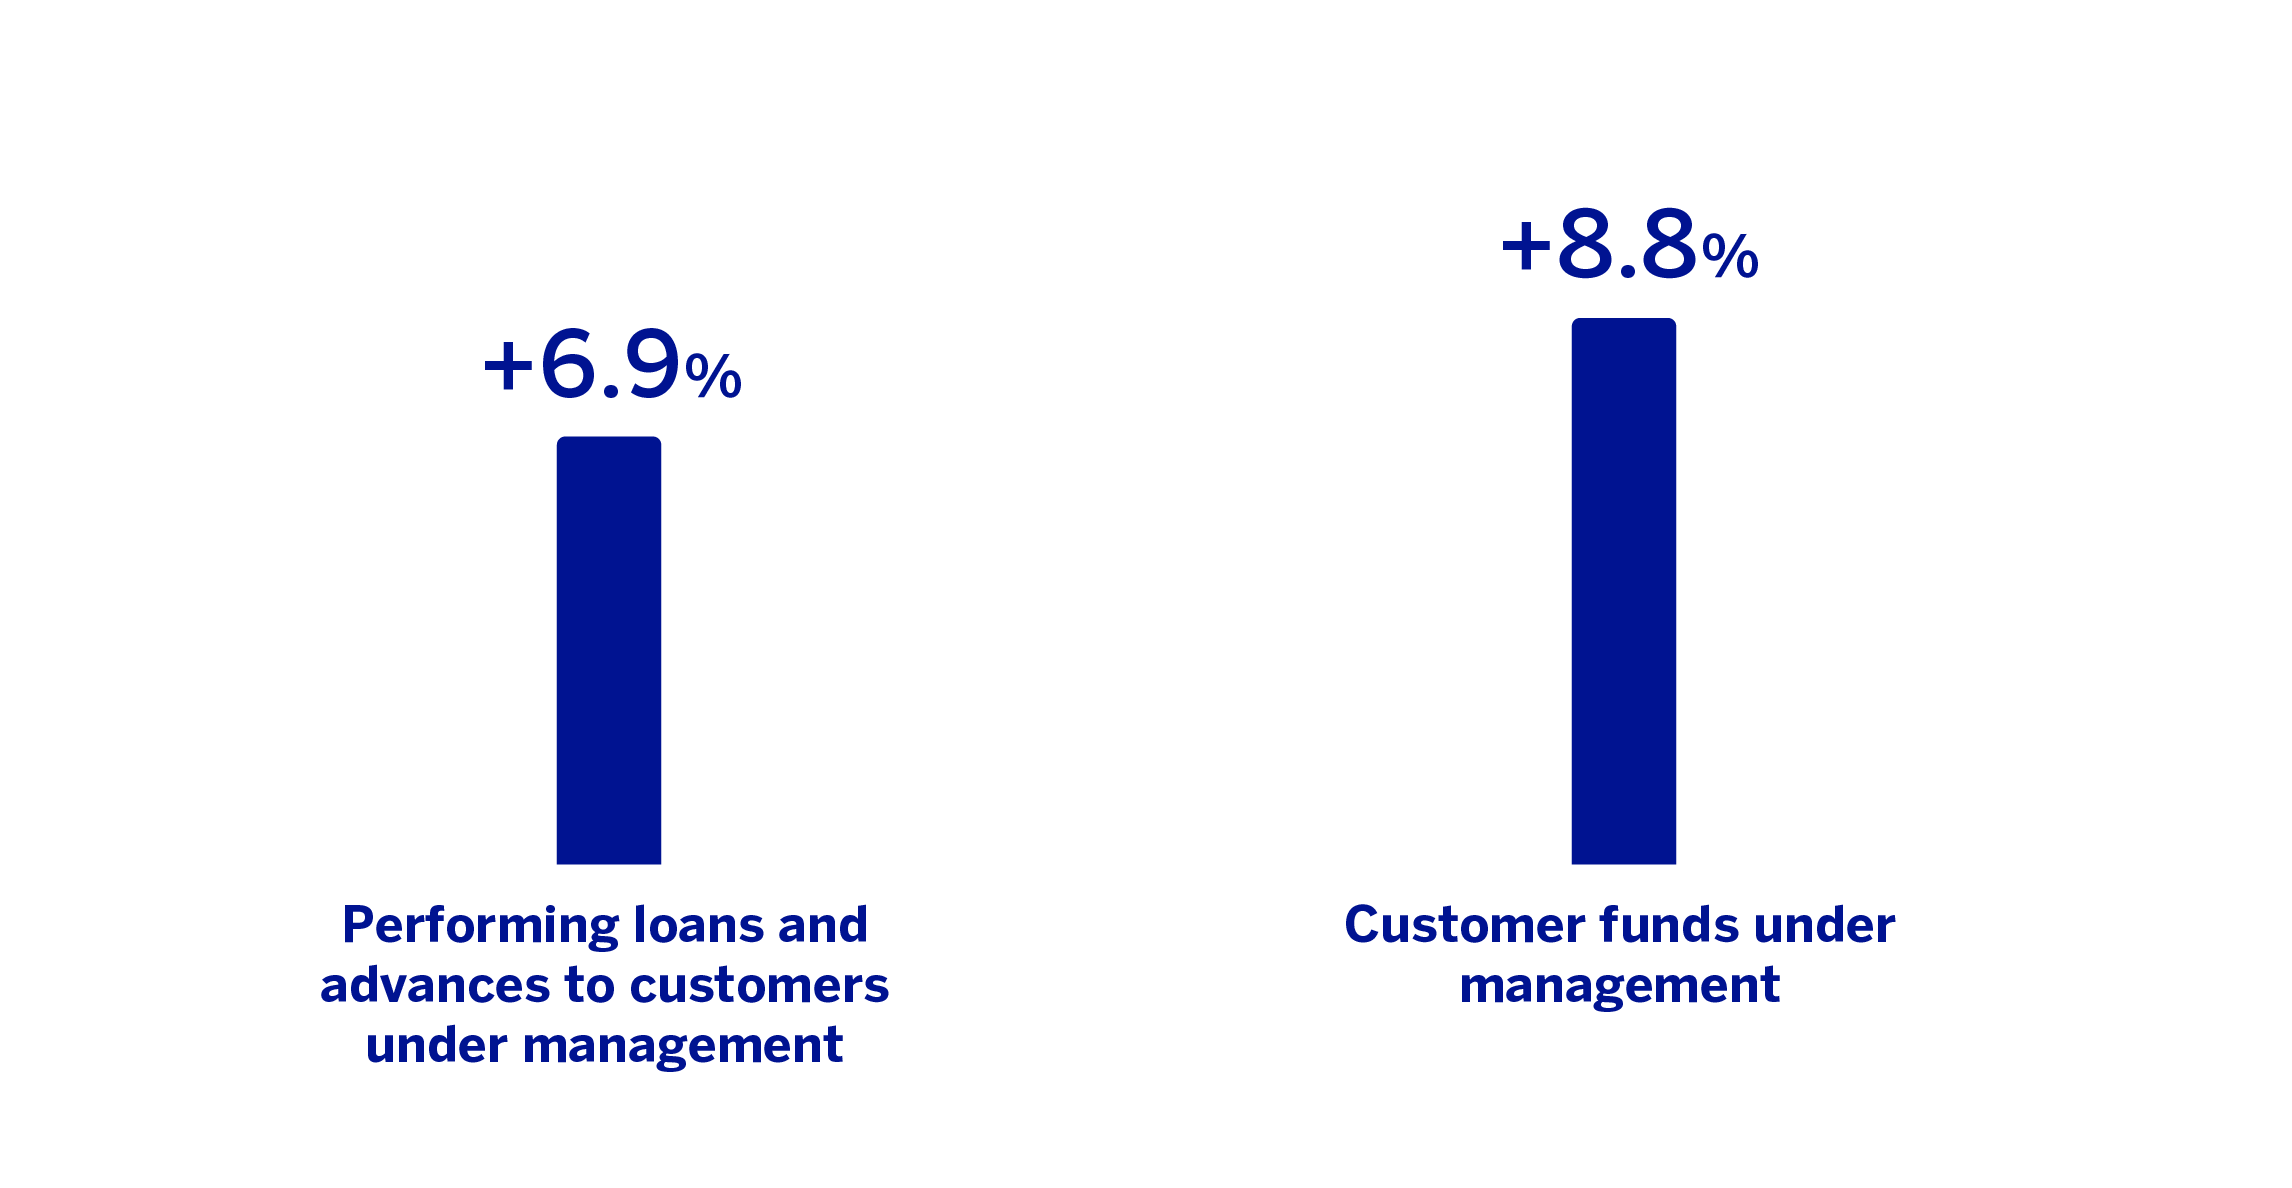
Lending activity (performing loans under management) increased by 6.9%, with a more dynamic growth in the wholesale portfolio (+9.0%) and a favorable evolution of all products in the retail portfolio, which grew by 4.5%.
Customer funds under management grew by 8.8% compared to the closing balances at the end of 2025, where the evolution of demand deposits (+7.3%) and time deposits (+9.5%) stands out.
The most relevant aspects related to the area's activity during the second quarter of the year 2026 have been:
Lending activity increased by 4.2%, mainly supported by the dynamism of corporate loans (+6.4%) and the evolution of all products in the retail segment (+2.3%).
With regard to credit quality, the area's NPL ratio stood at 4.0%, which represents a decrease of 18 basis points compared to the previous quarter, due to the favorable evolution of Peru and Colombia which offset the deterioration in Argentina and Chile. For its part, the NPL coverage ratio for the area was 89%, representing a decrease of 74 basis points compared to the end of March, with declines originating mainly in Argentina, and to a lesser extent Colombia and Chile.
Customer funds under management increased at a rate of 3.2%, thanks to the boost from customer deposits, which increased by 3.4%.
South America generated a net attributable profit of €556 million in the first half of 2026, which represents a year-on-year growth of 33.6% at current exchange rates, favored by the evolution of recurring revenues in the banking business. Within the main countries of the area, the evolution of the net attributable profit in Colombia stood out.
Meanwhile, the impact of the adjustment for hyperinflation of subsidiaries domiciled in Argentina stands out, which implies, among other effects, the recording of the loss on the monetary position in the item "Other operating income and expenses" in the income statement. This impact amounted to €279 million in the period January - June 2026, above the €211 million recorded in the period January - June 2025.
More detailed information on the most representative countries of the business area is provided below.
Argentina
Macro and industry trends
The economic recovery has continued during the first months of 2026, led by the primary sectors and some services, and the strength of energy exports. The performance of the industrial and construction sectors continues to be weak, as well as formal job creation. Despite this, BBVA Research leaves its growth forecast for 2026 unchanged at 3.0%. For its part, inflation has hovered around 33% during the first half of the year (in June it stood at 33.2%) and is expected to moderate going forward, standing at 29% at the end of 2026. Greater exchange rate stability, lower pressure on basic input prices and a gradual normalization of regulated prices should favor the correction.
The banking system is growing at a rapid pace, although inflation control entails that the credit and deposit volume growth is more moderate than in previous quarters. With data at the end of June 2026, total lending increased by 45.0% compared to June 2025, favored by consumer, corporate and, above all, mortgage portfolios, which grew by 31%, 52% and 107% year-on-year, respectively. For their part, deposits have decelerated their growth and at the end of June recorded a year-on-year growth of 33%. Finally, the NPL ratio has rebounded due to the growth in household credit defaults, standing at 7.3% at the end of April 2026.
Activity and results
In the first half of 2026, the lending activity recorded a growth of 14.1% (below the accumulated inflation rate which reached (+17,0%), while in the second quarter, this increase stood at 8.9% (above the 6.8% quarterly inflation rate), in both cases favored by the performance of corporate loans. At the end of June 2026, the NPL ratio stood at 6.4%, an increase of 10 basis points compared to the first quarter, originating from NPL inflows in the retail portfolio and affecting in turn the NPL coverage ratio, which stood at 76%, representing a decrease of 3 percentage points in the period.
Customer funds grew by 15.3% in the first half of 2026 (8.6% in the second quarter), with generalized growth across all products, especially in the corporate segment.
Regarding the evolution of the income statement16, the cumulative net attributable profit at the end of June 2026 stood at €73 million, with growth in recurring revenue, offset, among others, by a more negative impact for hyperinflation compared to the first half of 2025 and, especially, by an increase in provisions for impairment in financial assets (due to higher requirements in the retail portfolio, partly affected by a larger portfolio volume). Meanwhile, the accumulated cost of risk stood at 7.70%, which represents a decrease of 14 basis points compared to the cost of risk of the preceding quarter. The result of the second quarter reached €46 million, which represents an improvement compared to the previous quarter, favored mainly by a lower adjustment for hyperinflation and an improvement in NTI.
Colombia
Macro and industry trends
Private consumption and the services sector have continued to support economic activity during the first months of 2026, offsetting the lack of dynamism in investment. The progressive reduction in the uncertainty associated with the political change and the effects of the minimum wage increase should help maintain GDP growth going forward. Despite this, BBVA Research revises its growth forecast for 2026 slightly downwards to 2.6%, two tenths below the previous scenario. Price pressures justify the restrictive tone of monetary policy. Thus, headline inflation could close 2026 at 7%, compared to 6.1% in June, and benchmark interest rates could do so at 12.25% (12% in June).
Total credit growth in the banking system stood at 9.1% year-on-year in May 2026, with growth across all portfolios. Thus, corporate lending, mortgage lending, and consumer lending portfolios showed year-on-year growth rates of 8.0%, 11.9% and 9.8%, respectively, in May 2026. On the other hand, total deposits grew by 11.3% year-on-year at the end of May 2026, with a performance marked by the growth in demand deposits. Thus, demand and time deposits grew by 14.6% and 7.4% year-on-year respectively. The system's NPL ratio has improved in the last few months, standing at 3.76% in May 2026, 65 basis points below the figure for the same month of the previous year.
Activity and results
Lending activity grew at a rate of 5.1% compared to the end of 2025 (3.3% in the second quarter), favored by the performance of the corporate banking segment. In terms of asset quality indicators, the NPL ratio stood at 3.7%, representing a decrease of 34 basis points with respect to the previous quarter and 55 basis points compared to the end of the previous year, continuing the positive trend of recent quarters. On the other hand, coverage stood at 85%, with a decrease of 112 basis points compared to the previous quarter.
Customer funds grew by 6.9% compared to the end of 2025 and 3.4% during the second quarter. In the first six months of 2026, time deposits increased by 7.7%, demand deposits showed an evolution of 7.0%, and off-balance sheet funds of 4.4%.
The cumulative net attributable profit at the end of June 2026 stood at €175 million, that is, 123.5% higher than at the result at the end of the same period of the previous year, favored mainly by growth in the net interest income and lower loan-loss provisions due to lower requirements in the retail portfolio. For its part, the accumulated cost of risk stood at 2.02% at the end of June 2026, at similar levels to the previous quarter. The net attributable profit of the quarter stood at €96m, 21.1% above the previous quarter, favored by the growth in net interest income and a lower income tax expense.
Peru
Macro and industry trends
Economic activity exhibited greater dynamism than expected in the first months of 2026, supported by private consumption and investment. According to BBVA Research, growth for the full year could reach 3.1%, two tenths above what was forecast in the previous scenario, conditional on the evolution of the conflict in the Middle East and its impact on oil prices, the effects of the El Niño climate phenomenon and the political environment. Regarding the price environment, inflation is forecast to remain relatively high during the second half of the year, closing the year at 4.1%, levels similar to those observed in June. The persistence of inflation above the central bank's target range makes further benchmark interest rate hikes more likely, bringing rates to 4.75% in December (4.25% in June).
Total lending in the Peruvian banking system increased by 7.4% year-on-year in May 2026, with positive growth in all portfolios. Thus, the consumer credit portfolio grew by 14.0% year-on-year, the mortgage portfolio increased by 7.3% and the corporate loan portfolio increased by 5.2% year-on-year. For their part, the system's total deposits registered a year-on-year growth of 11.6% in May 2026, thanks to the 15.6% growth in demand deposits and 4.0% in time deposits. Finally, the system's NPL ratio continued on a downward trend, reaching a rate of 2.83% in May 2026.
Activity and results
Lending activity grew by 5.6% compared to the end of December 2025 (a 3.3% during the second quarter), driven by corporate loans, with a growth of 5.8%, followed by 7.4% in consumer loans. Regarding the asset quality indicators, the NPL ratio improved compared to the end of March 2026 (-21 basis points and -39 basis points compared to the end of the previous year) placing at 3.3%, reflecting continued strong recovery performance and contained entries. Meanwhile, the NPL coverage ratio was 105%, which represents an increase of 183 basis points compared to the end of March, supported by the reduction in non-performing loans.
Customers funds under management increased during the first semester of 2026 (+5.9%, and stable compared to the second quarter), thanks to the favorable performance in customer deposits (+5.6%), mainly from retail customers.
BBVA Peru's cumulative attributable profit stood at €194 million at the end of June 2026, that is, 23.9% above the result achieved in the first half of the previous year (€155 million). In the period, a growth in net interest income was observed, associated with a higher profitability and volume of the loan portfolio, as well as higher fees and commissions and NTI (results from the Global Markets unit) and lower loan-loss provisions. For its part, the cumulative cost of risk at the end of the second quarter stood at 1.25%, which represents a decrease of 26 basis points compared to the cost of risk of the previous quarter. The profit of the quarter stood at €113 million, which is a variation of 39.5% compared to the previous quarter, mainly as a result of lower loan-loss provisions in the wholesale portfolio and the release of provisions for special funds, with a positive contribution from the net interest income.
16 At current rates, that is, the impact of exchange rate fluctuations on the profit and loss account is not excluded.
Read legal disclaimer of this report.