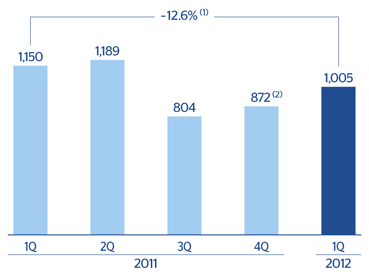
In the first quarter of 2012 the BBVA Group had a net attributable profit of €1,005m. The most significant aspect of this result is its high quality:
- The most recurring revenue (net interest income plus fee income) was up for the fifth quarter in a row, thanks to the customer-centric focus, retail business model and geographical diversification of the BBVA Group’s customers and products.
- Net interest income has performed very positively thanks to excellent price management in all the geographical areas and the strength of activity in emerging markets. In addition, the euro balance sheet was favored by a reduction in finance costs and the fall in interest rates.
- Income from fees and commissions grew, despite the lower activity in Spain and the coming into effect in 2011 of regulatory limitations in some of the Group’s geographical areas.
-
NTI was at levels similar to those seen in the fourth quarter of 2011.
-
Equity-accounted income continues to rise thanks to the growing contribution from CNCB.
- The heading other operating income and expenses continues to benefit from the positive performance of the insurance business in all the geographical areas, but also includes the increased allocations to the deposit guarantee funds in the different regions where BBVA operates.
-
Operating expenses increased at a slower pace than in previous quarters, as the biggest investment effort has already been made in previous periods, and their evolution has therefore started to be more in line with that of revenue.
-
Impairment losses on financial assets were at very similar levels to the average quarterly figure reported in 2011.
Consolidated income statement: quarterly evolution
(Million euros)
|
2012 |
2011 |
|
1Q |
4Q |
3Q |
2Q |
1Q |
| Net interest income |
3,597 |
3,485 |
3,286 |
3,215 |
3,175 |
| Net fees and commissions |
1,216 |
1,136 |
1,143 |
1,167 |
1,114 |
| Net trading income |
367 |
416 |
(25) |
336 |
752 |
| Dividend income |
27 |
230 |
50 |
259 |
23 |
| Income by the equity method |
193 |
207 |
150 |
123 |
121 |
| Other operating income and expenses |
47 |
42 |
22 |
62 |
79 |
| Gross income |
5,447 |
5,515 |
4,627 |
5,162 |
5,263 |
| Operating Costs |
(2,585) |
(2,652) |
(2,461) |
(2,479) |
(2,359) |
| Personnel expenses |
(1,379) |
(1,404) |
(1,325) |
(1,306) |
(1,276) |
| General and administrative expenses |
(974) |
(1,021) |
(920) |
964 |
(887) |
| Depreciation and amortization |
(232) |
(227) |
(216) |
(208) |
(196) |
| Operating income |
2,862 |
2,863 |
2,166 |
2,683 |
2,904 |
| Impairment on financial assets (net) |
(1,085) |
(1,337) |
(904) |
(962) |
(1,023) |
| Provisions (net) |
(131) |
(182) |
(94) |
(83) |
(150) |
| Other gains (losses) |
(222) |
(1,718) |
(166) |
(154) |
(71) |
| Income before tax |
1,423 |
(375) |
1,002 |
1,484 |
1,659 |
| Income tax |
(250) |
368 |
(95) |
(189) |
(369) |
| Net income |
1,173 |
(7) |
907 |
1,295 |
1,290 |
| Non-controlling interests |
(168) |
(132) |
(103) |
(106) |
(141) |
| Net attributable profit |
1,005 |
(139) |
804 |
1,189 |
1,150 |
| Net one-offs (1) |
- |
(1,011) |
- |
- |
- |
| Net attributable profit (excluding one-offs) |
1,005 |
872 |
804 |
1,189 |
1,150 |
| Basic earnings per share (euros) |
0.20 |
(0.03) |
0.17 |
0.25 |
0.24 |
| Basic earnings per share excluding one-offs (euros) (1) |
0.20 |
0.18 |
0.17 |
0.25 |
0.24 |
(1) In the fourth quarter of 2011 a charge was booked for goodwill impairment in the United States.
Consolidated income statement
(Million euros)
|
1Q12 |
Δ% |
Δ% at constant exchange rates |
1Q11 |
| Net interest income |
3,597 |
13.3 |
12.5 |
3,175 |
| Net fees and commissions |
1,216 |
9.1 |
8.2 |
1,114 |
| Net trading income |
367 |
(51.2) |
(51.6) |
752 |
| Dividend income |
27 |
16.6 |
15.6 |
23 |
| Income by the equity method |
193 |
60.1 |
60.1 |
121 |
| Other operating income and expenses |
47 |
(40.2) |
(34.5) |
79 |
| Gross income |
5,447 |
3.5 |
2.9 |
5,263 |
| Operating Costs |
(2,585) |
9.6 |
8.6 |
(2,359) |
| Personnel expenses |
(1,379) |
8.0 |
7.1 |
(1,276) |
| General and administrative expenses |
(974) |
9.8 |
9.1 |
(887) |
| Depreciation and amortization |
(232) |
18.2 |
16.5 |
(196) |
| Operating income |
2,862 |
(1.5) |
(1.8) |
2,904 |
| Impairment on financial assets (net) |
(1,085) |
6.0 |
5.9 |
(1,023) |
| Provisions (net) |
(131) |
(12.9) |
(13.0) |
(150) |
| Other gains (losses) |
(222) |
213.0 |
213.5 |
(71) |
| Income before tax |
1,423 |
(14.2) |
(14.7) |
1,659 |
| Income tax |
(250) |
(32.2) |
(32.3) |
(369) |
| Net income |
1,173 |
(9.1) |
(9.7) |
1,290 |
| Non-controlling interests |
(168) |
19.4 |
14.2 |
(141) |
| Net attributable profit |
1,005 |
(12.6) |
(12.8) |
1,150 |
| Net one-offs |
- |
- |
- |
- |
| Net attributable profit (excluding one-offs) |
1,005 |
(12.6) |
(12.8) |
1,150 |
| Basic earnings per share (euros) |
0.20 |
(18.3) |
|
0.17 |
| Basic earnings per share excluding one-offs (euros) |
0.20 |
(18.3) |
|
0.17 |
Net attributable profit
(Million euros)
(1) At constant exchange rates: -12.8%.
(2) Excluding one-offs.