Mexico highlights in the first quarter
- Positive lending growth, mainly in the retail portfolio.
- Prioritization of costs over volume in customer funds.
- High level of recurring revenue generation.
- BBVA Bancomer received the “Socially Responsible Company” award.
Industry Trends
In the first quarter of 2012 the Mexican banking sector maintained a high level of capitalization and adequate liquidity, which in turn has led to ongoing lending production and a positive trend in customer fund gathering.
In March, new regulation from the National Banking and Exchange Commission (CNBV) came into effect, which toughens the criteria over transfer to NPLs of restructured and renegotiated loans. The new criteria could bring the NPL figure upward as the year progresses. However, the Group allocates provisions according to expected loss models and therefore, this regulation is not expected to require increased provisions.
The evolution of the peso/euro exchange rate has been characterized by general appreciation in the quarter and a slight depreciation over the last twelve months, accentuated in the average exchange rate. The peso’s impact on the Group’s financial statements has therefore been positive in the quarter, but negative for the year. Unless otherwise indicated, all comments below on percentage changes refer to constant exchange rate, with the aim of providing a better understanding of the performance of the business in Mexico.
Income statement
(Million euros)
|
|
Units: |
|
Mexico |
Banking Business |
Pensions and Insurance |
|
1Q12 |
Δ% |
Δ% (1) |
1Q11 |
1Q12 |
Δ% |
Δ% (1) |
1Q11 |
1Q12 |
Δ% |
Δ% (1) |
1Q11 |
| Net interest income |
1,013 |
6.1 |
9.4 |
955 |
986 |
5.3 |
8.6 |
936 |
25 |
47.0 |
51.6 |
17 |
| Net fees and commissions |
302 |
1.2 |
4.4 |
299 |
285 |
1.1 |
4.3 |
282 |
14 |
1.5 |
4.6 |
14 |
| Net trading income |
73 |
(39.4) |
(37.5) |
120 |
51 |
(46.1) |
(44.4) |
94 |
22 |
(16.6) |
(14.0) |
26 |
| Other income/expenses |
62 |
21.3 |
25.1 |
51 |
(32) |
1.5 |
4.7 |
(32) |
110 |
10.5 |
14.0 |
99 |
| Gross income |
1,450 |
1.7 |
4.9 |
1,425 |
1,291 |
0.7 |
3.9 |
1,282 |
170 |
9.1 |
12.5 |
156 |
| Operating costs |
(553) |
6.3 |
9.6 |
(520) |
(521) |
6.7 |
10.0 |
(489) |
(42) |
0.8 |
3.9 |
(42) |
| Personnel expenses |
(235) |
2.2 |
5.4 |
(230) |
(216) |
2.3 |
5.5 |
(211) |
(19) |
1.2 |
4.4 |
(19) |
| General and administrative expenses |
(286) |
8.3 |
11.7 |
(264) |
(275) |
8.6 |
12.1 |
(253) |
(23) |
1.8 |
5.0 |
(22) |
| Deprecation and amortization |
(31) |
22.3 |
26.1 |
(26) |
(31) |
24.2 |
28.2 |
(25) |
(0) |
(43.2) |
(41.5) |
(1) |
| Operating income |
897 |
(0.8) |
2.3 |
905 |
769 |
(3.0) |
0.1 |
793 |
128 |
12.1 |
15.7 |
114 |
| Impairment on financial assets (net) |
(314) |
1.4 |
4.6 |
(310) |
(314) |
1.4 |
4.6 |
(310) |
- |
- |
- |
- |
| Provisions (net) and other gains (losses) |
(15) |
33.4 |
37.6 |
(11) |
(14) |
32.4 |
36.6 |
(10) |
(1) |
50.1 |
54.8 |
(1) |
| Income before tax |
568 |
(2.7) |
0.4 |
584 |
441 |
(6.6) |
(3.7) |
473 |
127 |
11.9 |
15.5 |
113 |
| Income tax |
(138) |
(11.4) |
(8.6) |
(156) |
(101) |
(17.9) |
(15.4) |
(124) |
(36) |
12.0 |
15.5 |
(32) |
| Net income |
430 |
0.5 |
3.7 |
428 |
340 |
(2.6) |
0.5 |
349 |
91 |
11.9 |
15.4 |
81 |
| Non-controlling interests |
(1) |
15.8 |
19.5 |
(1) |
(0) |
1.0 |
4.2 |
- |
(1) |
15.2 |
18.8 |
(1) |
| Net attributable profit |
430 |
0.5 |
3.6 |
428 |
340 |
(2.6) |
0.5 |
349 |
90 |
11.9 |
15.4 |
80 |
(1) At constant exchange rate.
Balance sheet
(Million euros)
|
|
Units: |
|
Mexico |
Banking Business |
Pensions and Insurance |
|
31-03-12 |
Δ% |
Δ% (1) |
31-03-11 |
31-03-12 |
Δ% |
Δ% (1) |
31-03-11 |
31-03-12 |
Δ% |
Δ% (1) |
31-03-11 |
| Cash and balances with central banks |
5,173 |
0.3 |
0.8 |
5,160 |
5,173 |
0.3 |
0.8 |
5,160 |
- |
- |
- |
- |
| Financial assets |
27,631 |
8.2 |
8.8 |
25,532 |
22,350 |
7.2 |
7.8 |
20,847 |
5,538 |
12.1 |
12.8 |
4,939 |
| Loans and receivables |
39,472 |
(2.7) |
(2.1) |
40,553 |
39,024 |
(3.0) |
(2.4) |
40,227 |
513 |
33.8 |
34.5 |
384 |
| Loans and advances to customers |
35,058 |
7.1 |
7.6 |
32,749 |
34,831 |
7.0 |
7.6 |
32,560 |
258 |
15.2 |
15.8 |
224 |
| Loans and advances to credit institutions and other |
4,413 |
(43.4) |
(86.4) |
7,804 |
4,192 |
(45.3) |
(87.1) |
7,667 |
255 |
59.9 |
27.6 |
159 |
| Tangible assets |
1,059 |
22.5 |
23.2 |
864 |
1,052 |
22.8 |
23.5 |
857 |
6 |
(9.9) |
(9.4) |
7 |
| Other assets |
2,735 |
149.2 |
150.6 |
1,097 |
3,371 |
31.9 |
32.6 |
2,556 |
201 |
8.9 |
9.5 |
185 |
| Total assets/Liabilities and equity |
76,070 |
3.9 |
4.5 |
73,206 |
70,970 |
1.9 |
2.5 |
69,647 |
6,259 |
13.5 |
14.1 |
5,514 |
| Deposits from central banks and credit institutions |
10,276 |
(17.3) |
(16.8) |
12,421 |
10,276 |
(17.3) |
(16.8) |
12,421 |
- |
- |
- |
- |
| Deposits from customers |
36,652 |
0.7 |
1.2 |
36,402 |
36,687 |
0.7 |
1.3 |
36,427 |
- |
- |
- |
- |
| Debt certificates |
4,512 |
28.9 |
29.6 |
3,500 |
4,512 |
28.9 |
29.6 |
3,500 |
- |
- |
- |
- |
| Subordinated liabilities |
2,716 |
25.5 |
26.2 |
2,164 |
3,533 |
(6.7) |
(6.2) |
3,787 |
- |
- |
- |
- |
| Financial liabilities held for trading |
5,751 |
29.5 |
30.2 |
4,441 |
5,751 |
29.5 |
30.2 |
4,441 |
- |
- |
- |
- |
| Other liabilities |
11,657 |
8.9 |
9.6 |
10,700 |
6,029 |
2.5 |
3.1 |
5,879 |
5,957 |
15.0 |
15.7 |
5,178 |
| Economic capital allocated |
4,507 |
26.0 |
26.7 |
3,577 |
4,184 |
31.1 |
31.8 |
3,192 |
303 |
(9.9) |
(9.4) |
336 |
(1) At constant exchange rate.
Significant ratios
(Percentage)
|
Mexico |
|
31-03-12 |
31-12-11 |
31-03-11 |
| Efficiency ratio |
38.1 |
36.4 |
36.5 |
| NPA ratio |
3.8 |
3.7 |
3.4 |
| NPA coverage ratio |
116 |
120 |
136 |
| Risk premium |
3.52 |
3.49 |
3.62 |
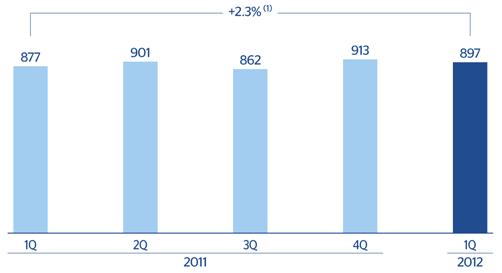
Mexico. Operating income
(Million euros at constant exchange rate)
(1) At current exchange rate: -0.8%.
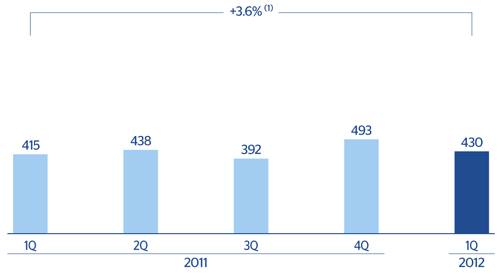
Mexico. Net attributable profit
(Million euros at constant exchange rate)
(1) At current exchange rate +0.5%