Eurasia highlights in the first quarter
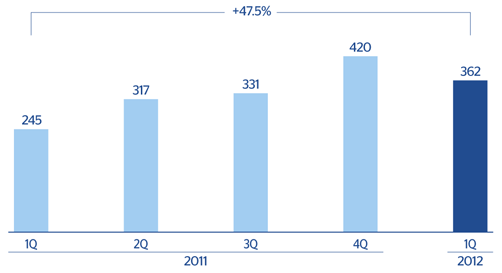
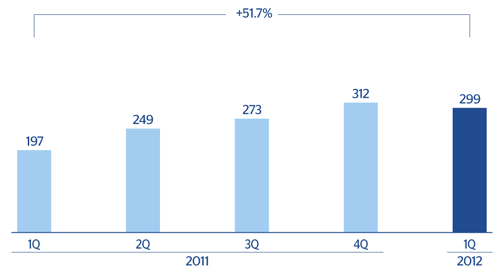
- Year-on-year comparison affected by the incorporation of Garanti in March 2011.
- Garanti closed 2011 as the leading Turkish bank in terms of earnings and profitability.
- CNCB increased its earnings in 2011 by 43%.
Industry Trends
The most relevant events affecting this business area in the first quarter of 2012 are listed below:
- The economic dichotomy between the central countries and the peripheral European countries remains and determines the performance of banking institutions in the area. However, recent measures adopted by the ECB have managed to lower tensions in the markets and reduce financing costs.
- The EBA’s capital recommendations have led the sector to undertake recapitalization processes such as capital increases or deleveraging operations, aimed basically at decreasing the volume of toxic assets and reducing exposure in the wholesale business.
- The Turkish Central Bank has maintained interest rates unchanged, although it has taken some actions to make sure that inflation is kept at the target levels.
- The Chinese authorities have implemented a number of initiatives to control any possible imbalance in the real estate market. These measures are focused basically on preventing a hard landing of the local economy.
Income statement
(Million euros)
|
Eurasia |
|
1Q12 |
Δ% |
1Q11 |
| Net interest income |
182 |
76.3 |
103 |
| Net fees and commissions |
109 |
72.8 |
63 |
| Net trading income |
42 |
32.0 |
32 |
| Other income/expenses |
201 |
44.4 |
139 |
| Gross income |
534 |
58.3 |
337 |
| Operating costs |
(173) |
87.3 |
(92) |
| Personnel expenses |
(88) |
49.5 |
(59) |
| General and administrative expenses |
(70) |
140.4 |
(29) |
| Deprecation and amortization |
(15) |
239.8 |
(4) |
| Operating income |
362 |
47.5 |
245 |
| Impairment on financial assets (net) |
(25) |
(14.6) |
(29) |
| Provisions (net) and other gains (losses) |
(6) |
n.m. |
6 |
| Income before tax |
330 |
48.7 |
222 |
| Income tax |
(31) |
25.2 |
(25) |
| Net income |
299 |
51.7 |
197 |
| Non-controlling interests |
- |
- |
- |
| Net attributable profit |
299 |
51.7 |
197 |
Balance sheet
(Million euros)
|
Eurasia |
|
31-03-12 |
Δ% |
31-03-11 |
| Cash and balances with central banks |
1,554 |
7.9 |
1,440 |
| Financial assets |
12,045 |
13.0 |
10,659 |
| Loans and receivables |
36,231 |
1.5 |
35,696 |
| Loans and advances to customers |
32,449 |
1.9 |
31,853 |
| Loans and advances to credit institutions and other |
3,782 |
(1.6) |
3,842 |
| Inter-area positions |
- |
- |
7,591 |
| Tangible assets |
602 |
9.7 |
549 |
| Other assets |
1,141 |
18.7 |
962 |
| Total assets/Liabilities and equity |
51,574 |
(9.4) |
56,896 |
| Deposits from central banks and credit institutions |
15,012 |
(24.0) |
19,740 |
| Deposits from customers |
22,087 |
(21.4) |
28,117 |
| Debt certificates |
788 |
30.9 |
602 |
| Subordinated liabilities |
1,869 |
4.5 |
1,788 |
| Inter-area positions |
3,674 |
n.m. |
- |
| Financial liabilities held for trading |
370 |
45.3 |
255 |
| Other liabilities |
3,708 |
77.8 |
2,086 |
| Economic capital allocated |
4,065 |
(5.6) |
4,308 |
Significant ratios
(Percentage)
|
Eurasia |
|
31-03-12 |
31-12-11 |
31-03-11 |
| Efficiency ratio |
32.3 |
33.1 |
27.3 |
| NPA ratio |
1.6 |
1.5 |
1.2 |
| NPA coverage ratio |
114 |
123 |
131 |
| Risk premium |
0.29 |
0.46 |
0.46 |
Eurasia. Operating income
(Million euros)
Eurasia. Net attributable profit
(Million euros)


