The United States highlights in the first quarter
- Strong business activity in the quarter.
- Improved credit quality is the main driver of growth in earnings.
- Substantial progress in brand recognition.
Industry Trends
Revenues were down in the US banking industry in 2011, mainly as a result of low interest rates, which are expected to continue over the next few years. Fee income also continued to be negatively impacted by regulatory changes, and it is expected to remain flat for the same reasons. The recent Durbin Amendment will also continue to impact this revenue item.
Improvements in credit quality continue to bolster the income statements in the banks’ system.
In terms of activity in the sector, loans showed steady growth, with a reduction in runoff portfolios and growth in commercial and industrial loans, as well as residential real estate.
Regarding capital, in March this year the Federal Reserve (Fed) published the results of its Comprehensive Capital Analysis and Review (CCAR) process. This is a study of the capital planning processes of the 19 biggest banks in the country, including a forward-looking analysis and detailed assessment and evaluation of these plans in a stress scenario (unemployment rate rising to 13%, a 21% fall in housing prices and a 50% fall in the stock market). Over the coming months, activity is expected to increase with respect to capital, as the CCAR results will allow some activity in this respect.
Over the last 12 months, the dollar/euro exchange rate appreciated. Over the quarter the fixing price was down, although on average the US currency has also appreciated. Thus the impact of the currency on the Group’s balance sheet and activity is positive on a year-on-year basis. In contrast, over the quarter its effect is positive on earnings but negative on the balance sheet and activity. Unless indicated otherwise, all comments below on percentage changes refer to constant exchange rates, with the aim of providing a better understanding of the performance of the business in the United States.
Income statement
(Million euros)
|
|
Units: |
|
The United States |
BBVA Compass |
|
1Q12 |
Δ% |
Δ% (1) |
1Q11 |
1Q12 |
Δ% |
Δ% (1) |
1Q11 |
| Net interest income |
420 |
1.3 |
(3.0) |
415 |
367 |
(1.4) |
(1.6) |
373 |
| Net fees and commissions |
160 |
3.2 |
(1.3) |
155 |
132 |
(2.0) |
(2.3) |
135 |
| Net trading income |
39 |
(39.6) |
(42.4) |
64 |
23 |
(47.4) |
(52.7) |
48 |
| Other income/expenses |
(19) |
16.0 |
11.2 |
(17) |
(19) |
16.1 |
17.9 |
(16) |
| Gross income |
599 |
(2.9) |
(7.1) |
616 |
503 |
(6.2) |
(6.9) |
539 |
| Operating costs |
(383) |
2.1 |
(2.3) |
(375) |
(332) |
(3.4) |
(3.8) |
(345) |
| Personnel expenses |
(219) |
10.8 |
6.0 |
(198) |
(189) |
3.7 |
4.1 |
(182) |
| General and administrative expenses |
(123) |
(8.5) |
(12.4) |
(134) |
(102) |
(12.6) |
(14.0) |
(119) |
| Deprecation and amortization |
(42) |
(4.6) |
(8.6) |
(44) |
(40) |
(7.8) |
(8.7) |
(44) |
| Operating income |
216 |
(10.6) |
(14.5) |
241 |
171 |
(11.1) |
(12.3) |
195 |
| Impairment on financial assets (net) |
(36) |
(64.5) |
(66.0) |
(101) |
(32) |
(61.1) |
(67.9) |
(99) |
| Provisions (net) and other gains (losses) |
(12) |
54.8 |
47.5 |
(8) |
(12) |
103.2 |
114.7 |
(5) |
| Income before tax |
168 |
26.4 |
20.7 |
133 |
128 |
36.8 |
40.9 |
91 |
| Income tax |
(53) |
39.8 |
33.4 |
(38) |
(40) |
55.1 |
61.3 |
(25) |
| Net income |
115 |
21.1 |
15.6 |
95 |
88 |
29.9 |
33.3 |
66 |
| Non-controlling interests |
- |
- |
- |
- |
- |
- |
- |
- |
| Net attributable profit |
115 |
21.1 |
15.6 |
95 |
88 |
29.9 |
33.3 |
66 |
(1) At constant exchange rate.
Balance sheet
(Million euros)
|
|
Units: |
|
The United States |
BBVA Compass |
|
31-03-12 |
Δ% |
Δ% (1) |
31-03-11 |
31-03-12 |
Δ% |
Δ% (1) |
31-03-11 |
| Cash and balances with central banks |
4,970 |
(2.3) |
(8.2) |
5,089 |
2,691 |
3.7 |
4.1 |
2,584 |
| Financial assets |
8,519 |
18.1 |
11.1 |
7,211 |
7,656 |
11.8 |
13.1 |
6,768 |
| Loans and receivables |
41,433 |
8.2 |
1.7 |
38,307 |
32,836 |
5.8 |
6.4 |
30,861 |
| Loans and advances to customers |
39,220 |
6.0 |
(0.3) |
36,993 |
31,150 |
3.5 |
3.8 |
29,997 |
| Loans and advances to credit institutions and other |
2,213 |
68.5 |
58.4 |
1,314 |
1,685 |
85.6 |
95.1 |
864 |
| Inter-area positions |
- |
- |
- |
1,281 |
411 |
- |
- |
- |
| Tangible assets |
810 |
8.5 |
2.0 |
746 |
768 |
1.4 |
1.6 |
756 |
| Other assets |
2,153 |
(4.2) |
(10.0) |
2,249 |
1,868 |
(8.2) |
(9.1) |
2,054 |
| Total assets/Liabilities and equity |
57,885 |
5.5 |
(0.8) |
54,882 |
46,229 |
6.7 |
7.5 |
43,023 |
| Deposits from central banks and credit institutions |
7,996 |
14.3 |
7.4 |
6,996 |
4,349 |
39.6 |
44.0 |
3,020 |
| Deposits from customers |
38,666 |
(3.2) |
(9.0) |
39,937 |
34,851 |
2.7 |
3.0 |
33,841 |
| Debt certificates |
352 |
6.5 |
0.1 |
330 |
- |
- |
- |
- |
| Subordinated liabilities |
1,154 |
7.6 |
1.1 |
1,073 |
931 |
5.9 |
6.6 |
874 |
| Inter-area positions |
1,978 |
- |
- |
- |
- |
- |
- |
- |
| Financial liabilities held for trading |
428 |
11.3 |
4.6 |
385 |
420 |
31.5 |
35.0 |
312 |
| Other liabilities |
4,204 |
31.4 |
23.5 |
3,199 |
3,344 |
22.0 |
24.4 |
2,688 |
| Economic capital allocated |
3,106 |
4.9 |
(1.4) |
2,961 |
2,334 |
1.8 |
2.0 |
2,289 |
(1) At constant exchange rate.
Significant ratios
(Percentage)
|
The United States |
|
31-03-12 |
31-12-11 |
31-03-11 |
| Efficiency ratio |
64.0 |
64.4 |
60.9 |
| NPA ratio |
3.2 |
3.5 |
4.3 |
| NPA coverage ratio |
75 |
73 |
64 |
| Risk premium |
0.35 |
0.89 |
1.02 |
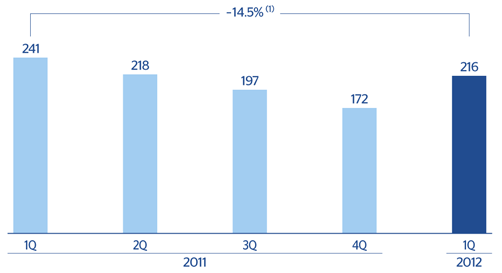
The United States. Operating income
(Million euros at constant exchange rate)
(1) At current exchange rate: - 10.6%.
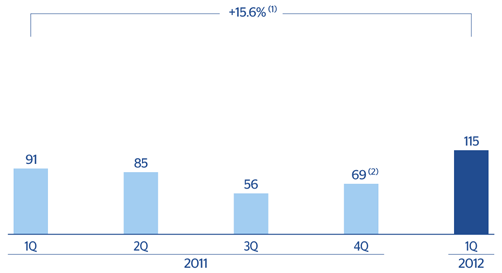
The United States. Net attributable profit
(Million euros at constant exchange rate)
(1) At current exchange rate: +21.1%.
(2) Excluding one-offs.