The BBVA Group’s income statement for the fourth quarter of 2011 has a significantly high level of revenue, which has allowed for a higher effort in loan-loss provisions. The most significant aspects of the statement are detailed below:
- The continuing upward trend in the most recurring revenue, i.e. gross income excluding NTI and dividends:
- Net interest income has risen for the fourth quarter in a row thanks to the increased business activity in emerging countries and appropriate price management carried out in all geographical areas.
- Income from fees and commissions were stable, despite the regulatory limitations in force in some areas, lower activity in Spain and greater efforts to maintain customer loyalty.
- Equity-accounted income was up considerably boosted by the contribution from CNBC.
- There was also a significant contribution from NTI after a particularly low third quarter, and from dividends, which include the payment from the stake in Telefónica.
-
Impairment losses on financial assets were up over the quarter, basically due to the increase of the Group’s loan-loss provisions, which took advantage of the higher revenue. Nonetheless, the figure for the year as a whole is 10.4% down on 2010.
- There was an adjustment to the value of goodwill in the United States of €1,011m after tax. Despite the positive performance of the franchise in 2011, the slower-than-expected economic recovery and low interest rates outlook, combined with growing regulatory pressure, all imply a slowdown in forecast earnings growth in this area. This adjustment is of an accounting nature only and does not have any negative consequence on the Group’s liquidity or capital adequacy.
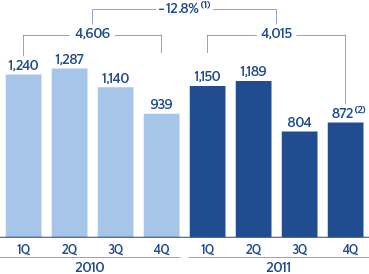
- The net attributable profit before applying the goodwill impairment was €872m in the fourth quarter and €4,015m for the year as a whole. Including the adjustment, the Group’s net attributable profit for 2011 came to €3,004m.
Consolidated income statement: quarterly evolution
(Million euros)
|
2011 |
2010 |
|
4Q |
3Q |
2Q |
1Q |
4Q |
3Q |
2Q |
1Q |
| Net interest income |
3,485 |
3,286 |
3,215 |
3,175 |
3,138 |
3,245 |
3,551 |
3,386 |
| Net fees and commissions |
1,136 |
1,143 |
1,167 |
1,114 |
1,135 |
1,130 |
1,166 |
1,106 |
| Net trading income |
416 |
(25) |
336 |
752 |
252 |
519 |
490 |
633 |
| Dividend income |
230 |
50 |
259 |
23 |
227 |
45 |
231 |
25 |
| Income by the equity method |
207 |
150 |
123 |
121 |
124 |
60 |
94 |
57 |
| Other operating income and expenses |
42 |
22 |
62 |
79 |
70 |
85 |
47 |
93 |
| Gross income |
5,515 |
4,627 |
5,162 |
5,263 |
4,946 |
5,084 |
5,579 |
5,301 |
| Operating costs |
(2,652) |
(2,461) |
(2,479) |
(2,359) |
(2,325) |
(2,262) |
(2,262) |
(2,118) |
| Personnel expenses |
(1,404) |
(1,325) |
(1,306) |
(1,276) |
(1,240) |
(1,211) |
(1,215) |
(1,149) |
| General and administrative expenses |
(1,021) |
(920) |
(964) |
(887) |
(887) |
(855) |
(855) |
(796) |
| Depreciation and amortization |
(227) |
(216) |
(208) |
(196) |
(199) |
(197) |
(192) |
(174) |
| Operating income |
2,863 |
2,166 |
2,683 |
2,904 |
2,621 |
2,821 |
3,317 |
3,183 |
| Impairment on financial assets (net) |
(1,337) |
(904) |
(962) |
(1,023) |
(1,112) |
(1,187) |
(1,341) |
(1,078) |
| Provisions (net) |
(182) |
(94) |
(83) |
(150) |
(75) |
(138) |
(99) |
(170) |
| Other gains (losses) |
(1,718) |
(166) |
(154) |
(71) |
(273) |
113 |
(88) |
(72) |
| Income before tax |
(375) |
1,002 |
1,484 |
1,659 |
1,162 |
1,609 |
1,789 |
1,862 |
| Income tax |
368 |
(95) |
(189) |
(369) |
(127) |
(359) |
(431) |
(510) |
| Net income |
(7) |
907 |
1,295 |
1,290 |
1,034 |
1,250 |
1,358 |
1,352 |
| Non-controlling interests |
(132) |
(103) |
(106) |
(141) |
(96) |
(110) |
(70) |
(113) |
| Net attributable profit |
(139) |
804 |
1,189 |
1,150 |
939 |
1,140 |
1,287 |
1,240 |
| Net one-offs (1) |
(1,011) |
- |
- |
- |
- |
- |
- |
- |
| Net attributable profit (excluding one-offs) |
872 |
804 |
1,189 |
1,150 |
939 |
1,140 |
1,287 |
1,240 |
| Basic earnings per share (euros) |
(0.03) |
0.17 |
0.25 |
0.24 |
0.22 |
0.28 |
0.31 |
0.30 |
| Basic earnings per share excluding one-offs (euros) (1) |
0.18 |
0.17 |
0.25 |
0.24 |
0.22 |
0.28 |
0.31 |
0.30 |
(1) In the fourth quarter of 2011 a charge was booked for goodwill impairment in the United States. The third quarter of 2010 includes capital gains from the sale-and-leaseback of retail branches which have been allocated to generic provisions for NPA, with no effect on net attributable profit.
Consolidated income statement
(Million euros)
|
2011 |
Δ% |
Δ% at constant exchange rates |
2010 |
| Net interest income |
13,160 |
(1.2) |
1.0 |
13,320 |
| Net fees and commissions |
4,560 |
0.5 |
2.6 |
4,537 |
| Net trading income |
1,479 |
(21.9) |
(20.4) |
1,894 |
| Dividend income |
562 |
6.3 |
6.7 |
529 |
| Income by the equity method |
600 |
79.2 |
79.3 |
335 |
| Other operating income and expenses |
205 |
(30.6) |
(32.7) |
295 |
| Gross income |
20,566 |
(1.6) |
0.3 |
20,910 |
| Operating costs |
(9,951) |
11.0 |
13.3 |
(8,967) |
| Personnel expenses |
(5,311) |
10.3 |
12.4 |
(4,814) |
| General and administrative expenses |
(3,793) |
11.8 |
14.5 |
(3,392) |
| Depreciation and amortization |
(847) |
11.3 |
13.9 |
(761) |
| Operating income |
10,615 |
(11.1) |
(9.5) |
11,942 |
| Impairment on financial assets (net) |
(4,226) |
(10.4) |
(8.7) |
(4,718) |
| Provisions (net) |
(510) |
5.7 |
6.6 |
(482) |
| Other gains (losses) |
(2,109) |
n.m. |
n.m. |
(320) |
| Income before tax |
3,770 |
(41.3) |
(40.1) |
6,422 |
| Income tax |
(285) |
(80.1) |
(79.6) |
(1,427) |
| Net income |
3,485 |
(30.2) |
(28.9) |
4,995 |
| Non-controlling interests |
(481) |
23.8 |
27.8 |
(389) |
| Net attributable profit |
3,004 |
(34.8) |
(33.7) |
4,606 |
| Net one-offs (1) |
(1,011) |
n.m. |
n.m. |
- |
| Net attributable profit (excluding one-offs) |
4,015 |
(12.8) |
(11.3) |
4,606 |
| Basic earnings per share (euros) |
0.64 |
(44.1) |
|
1.14 |
| Basic earnings per share excluding one-offs (euros) (1) |
0.85 |
(25.5) |
|
1.14 |
(1) In the fourth quarter of 2011 a charge was booked for goodwill impairment in the United States. The third quarter of 2010 includes capital gains from the sale-and-leaseback of retail branches which have been allocated to generic provisions for NPA, with no effect on net attributable profit.
Net attributable profit
(Million euros)
(1) At constant exchange rate: -11.3%.
(2) Excluding one-offs.