
The United States highlights in the fourth quarter
- Business plan up to speed and progress in building the franchise.
- Resilient net interest income despite unfavorable interest rate curve.
- Growth in target portfolios more than compensate the fall in construction real-estate lending.
- Continued improvement in risk indicators.
This area encompasses the Group’s business in the United States and in the Commonwealth of Puerto Rico. More precisely, it includes BBVA Compass, which accounted for 82% of the balance sheet in the area as of 31-Dec-2011. Due to its relative contribution, most of the comments below refer to this business unit. The area also covers the assets and liabilities of the BBVA office in New York, which specializes in transactions with large corporations.
The economic recovery in the United States slowed considerably at the start of 2011. This was largely due to a combination of temporary factors, including the upturn in oil prices and the longer than expected interruption in supply as a result of the earthquake in Japan. In addition, growing domestic and foreign fiscal uncertainty has contributed to slower quarterly growth in 2011 compared to 2010. The slight upturn in economic growth in the second half of the year was not enough to boost significantly the expectations of business and consumers. Household deleveraging, global fiscal uncertainty, sluggish residential investment, and restrictions in credit conditions all continue to limit economic growth.
Interventions by the Federal Reserve have flattened the yield curve, and interest rates outlook continues to be low over the coming years. Concerns continue to focus on lowering the unemployment rate and improving the real-estate market, while at the same time maintaining inflationary expectations under control. High energy and food prices are putting pressure on inflation. However, the major domestic economic stagnation and the slowdown of the global economy have preserved core prices within the Fed’s implicit target range.
The dollar’s exchange rate (fixing rate) against the euro appreciated in year-on-year and quarter-on-quarter terms, while the average rates have depreciated over the last 12 months by 4.7%. In contrast, the currency appreciated slightly in average rates over the quarter (up 1.1%). This means that the impact of the currency is positive on the balance sheet and business activity (both over the quarter and for the year as a whole), but negative on earnings over the last 12 months, although slightly positive in quarterly terms. Unless otherwise indicated, all comments below refer to changes at a constant exchange rate.
Below is a summary of the most relevant events in this area in the fourth quarter of 2011.
The United States franchise continues to show a resilient quarterly net interest income at constant exchange rate (€393m, down 1.5% on the figure for the previous quarter). This is very significant, taking into account the gradual shift in composition of the loan portfolio toward lower-risk products with narrower spreads. This resilience is the result of good management of customer spread. Net interest income for the year amounted to €1,590m, 7.4% down on the figure for 2010. Annual income from fees and commissions was up 1.1% year-on-year to €632m, despite the entry into force of regulations limiting them. All the above, together with lower NTI (down 8.1% year-on-year) caused by the turmoil on the markets, and a greater contribution to the Federal Deposit Insurance Corporation (FDIC), brought gross income in 2011 to €2,277m (down 7.0 year-on-year).
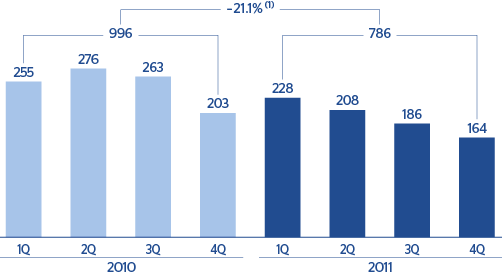
Operating expenses in the area continue in check, despite the investment made in both people and technology. They increase by only 2.8% on the 2010 figure to €1,491m. The result was an operating income of €786m, down 21.1% over the year.
The gradual improvement in the loan-book mix, with an additional increase in the weight of target portfolios (residential real estate and commercial) has had a clear impact on asset quality in the area, with NPA and coverage ratios which continue to improve their levels on the figures for the previous quarter, and the risk premium also falling significantly. The NPA ratio fell by 27 basis points on the figure of 30-Sep-2011, and closed 31-Dec-2011 at 3.6%. The coverage ratio was 73% (69% at the end of September 2011). The cumulative risk premium in 2011 fell once more in the last three months by 11 basis points to 0.93%, while impairment losses on financial assets for the year fell 48.7% on the 2010 figure to €346m.
The value of goodwill in the United States was adjusted in 2011 by €1,011m net of taxes. Despite the positive performance of the franchise in 2011, the slower-than-expected economic recovery, a low interest rate outlook and growing regulatory pressure, all imply a slowdown in expected earnings growth in this area. This goodwill adjustment is of an accounting nature only and does not have any negative impact on the liquidity or capital adequacy of either the area or the Group.
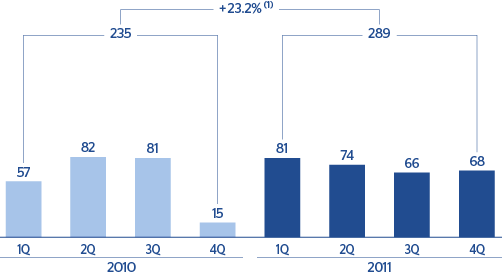
To sum up, the resilience of recurring revenue, tight control of expenses and lower loan-loss provisions explain the net attributable profit for 2011 of €289m (excluding the goodwill impairment), 23.2% up on the figure for 2010. Including the effect of the goodwill adjustment, the figure was a loss of €722m.