
Spain highlights in the fourth quarter
- Tight cost control of liabilities and improvement of spreads.
- Deleveraging process positive for the liquidity gap in the area.
- Successful exchange of preferred shares for convertible bonds.
- Stable NPA and coverage ratios.
The area of Spain includes all the segments of BBVA’s banking and non-banking business in the country.
In the fourth quarter of 2011, the commercial activity of Spanish financial institutions was influenced to a great extent by the necessary and positive deleveraging process carried out in the highest-risk sectors, the liquidity crunch in the wholesale funding markets, pressure on the costs of wholesale and retail liabilities and the deterioration of asset quality. The Spanish financial system is also still immersed in its own restructuring process. Among the events of the quarter reflecting this situation, there was the intervention of the Banco de Valencia and the completion of the auction of Caja del Mediterráneo (CAM), previously intervened by the Bank of Spain, which was finally awarded to Banco de Sabadell.
Against the backdrop of a growing liquidity crunch, the Spanish banking system’s commercial networks have therefore continued to focus on attracting stable funds. In the last quarter there was a notable issuance of promissory notes to individuals and companies (over €40,000m). In the loan book, household lending fell by 2.0% (latest available figures to November) on the December 2010 figure, a slightly lower decrease than at the close of the third quarter of 2011. New production of mortgages to individuals fell by 44.5% and consumer finance by 41.9%. Corporate deleveraging has been more notable, at 5.1% over the same time period. For the year as a whole, the volume of loans in the Spanish banking system has been curtailed by €61,264m (€75,397m since 2008). Demand for liability products focused on deposits and new conservative options such as promissory notes, which have been the focus of almost all the new funds gathered in the fourth quarter.
During 2011, increases in the base rates have led to a repricing of new credit transactions. At the same time, renewal of stable funds has been at prices in line with these reference base rates, which has improved customer spread.
Against this backdrop, BBVA continues to consolidate its leading position in the household and corporate segments, in both asset products (such as mortgage lending) and liability products (stable funds). It is also increasing the profitability of its net interest income (measured against ATA), despite the reduction in the portfolios of greatest risk and spread, thanks to good management of the customer spread, which has improved over the quarter to 2.10% in this area.
Gross lending to customers in Spain as of 31-Dec-2011 amounted to €214,156m, a year-on-year fall of 1.8% (less than the fall of 2.5% in the market as a whole). Yield on loans was up by 13 basis points on the figure for 31-Dec-2010.
Customer funds under management (deposits, mutual funds and pension funds, as well as promissory notes) amounted to €153,163m, a year-on-year fall of 0.7%. The fall was caused by the drop in off-balance-sheet funds, as stable funds in the balance sheet (including promissory notes and excluding repos and other balances related to Markets) were up 3.4% over the last 12 months to €109,358m as of 31-Dec-2011. Thus the financial deleveraging process, which is considered necessary and positive for the country’s economy, together with the favorable performance of these customer funds, have had a clearly positive impact on the liquidity gap in the area. It is worth noting that BBVA closed the year with a significant gain in market share of 21 basis points in household and corporate transactional accounts which reached 9.6% (latest available figures from December 2010 to November 2011). The Group’s issue of promissory notes through its commercial networks began strongly in September, and its market share amounted to 8.4% in December (latest available figures).
In off-balance-sheet funds, the Group manages €19,598m in mutual funds in Spain, a market share of 15.3%. BBVA’s assets under management fell by 3.1% over the quarter. The fall is still less marked than that recorded by the market as a whole, given the greater weight of the more conservative products offered by the Bank. BBVA’s fund manager remains the market leader in pension funds in Spain, with a share of 18.7% (figures for September) and assets under management up 2.9% over the last quarter to €17,224m.
Between September and October 2011 and for the second time in the year, the Dividend Option gave shareholders the chance to receive their remuneration in shares. The uptake has been very satisfactory, as 91% of those with shares deposited at BBVA have chosen this formula rather than a cash dividend payment. It is also worth noting that in December BBVA successfully closed the exchange of preference shares for mandatory subordinated bonds convertible into newly issued ordinary shares of BBVA. The take-up on the offer among investors was 98.7%, amounting to a total of €3,430m. The successful uptake of this operation and others reveals the great capillarity of the BBVA network, the trust of its customers in BBVA and the mutual commitment between them and the Bank.
Stable quarterly figures for net interest income and other revenue, the high level of efficiency, and competitive advantages in terms of asset quality with respect to the sector as a whole, have all characterized earnings for the area in 2011.
A combination of loan repricing, the greater weight of current and savings accounts, the high proportion of time deposits renewed at prices adjusted to the degree of customer bundling, and risk selectiveness have resulted in a net interest income for the year of €4,399m, with very stable quarterly figures (the figure for the fourth quarter was €1,091m). This was achieved despite the last six months of the year being characterized by more expensive wholesale funding and the loss of asset values as a result of market difficulties.
Income from fees and commissions in the fourth quarter remained stable at €332m in an environment of pressure from the financial markets influencing the fees linked to mutual funds, reduced M&A activity in the corporate sector, and cuts in fees to ensure greater customer loyalty. The figure for income from fees and commissions over the year was €1,468m, which accounts for more than 23% of recurring revenue (gross income minus NTI). Revenue from the insurance business was also positive, at €339m (up 3.1% year-on-year). This was due to a number of factors, including BBVA’s gains in market share in the main lines of activity in this business. NTI continues strongly affected by the negative performance of the financial markets. As a result of the above, gross income for the year as a whole was €6,357m (€7,055m the previous year).
BBVA’s efficiency ratio (44.1%) is also a competitive advantage, thanks to tight control of operating expenses, which fell by 0.5% on the figure for the previous year, despite the fact that its number of branches remained practically the same, unlike its competitors. Additionally, BBVA’s productivity ratios have also improved, opening up a gap in its favor compared with the rest of the system. All this is the result of the appropriate and efficient management of various distribution channels.
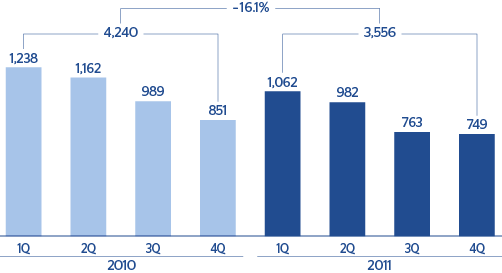
The operating income for 2011 was €3,556m (€4,240m in 2010). This reflects the resilience of BBVA’s recurrent earnings in a year plagued by economic and financial difficulties. At the same time, it reveals that it has room to meet the needs for loan-loss provisioning in the domestic market, with impairment losses on financial assets at €1,711m, representing 48% of the operating income.
Another competitive advantage with respect to its sector is BBVA’s asset quality in Spain, with a very stable NPA ratio of 4.8% as of 31-Dec-2011, notably lower than the 7.5% as the average for the market. There was practically no increase of asset impairments over the year in the area, while in the system as a whole the ratio was up 179 basis points. The coverage ratio remains at the same levels as the previous year, at 44%. The practically stable volume of distressed assets is due to a moderation of gross additions, with an increase of recoveries.
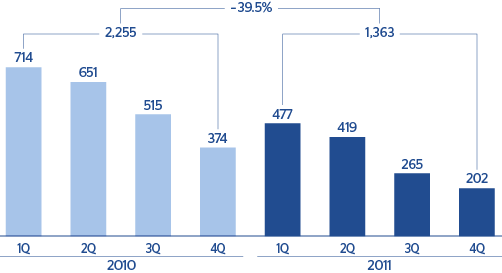
The absence of extraordinary earnings, compared with the figure of €249m the previous year, led to a 39.5% year-on-year decrease in the area’s profit to €1,363m.
Exposure to the developer sector continues to fall in Spain, and as of 31-Dec-2011 it stood at €14,158m, €2,450m below the figure at the close of 2010. Of this total, nearly 49% corresponds to finished properties, 17% to construction in progress and 26% to land. Out of the total, non-performing and substandard loans account for €5,795m. This figure is below that for the last quarter (€6,024m) and that for last year (€5,924m). The value of the collateral covering developer risk, based on up-to-date appraisals, is €19,288m, which maintains the average LTV at 73% and easily covers the portfolio value. In addition, specific and generic provisions cover 73% of NPL and substandard balances and 92% of the amount to be provisioned (the value in excess of the guarantees after applying the regulatory criteria that entered into force with Bank of Spain Circular 3/2010). BBVA also maintains a total of €5,101m in real estate assets at gross book value which originally were loans to companies. These properties have an average coverage ratio of 34.1%. It is also worth noting that coverage ratio for land stands at 37.5%. Out of this, 52% is developed land, 45% is building and only 2% is rustic land.