
South America highlights in the fourth quarter
- Net interest income reflects the high rate of growth in business activity.
- Improved business in pensions and insurance.
- Stable growth forecasts for the region.
- NPA ratio at an all-time low.
The South American area manages the Group’s banking, pension and insurance businesses in the region. The first half of 2011 saw the incorporation of Crédit Uruguay (purchased at the end of 2010 and merged with BBVA Uruguay in May 2011) and the sale of the Group’s stake in the insurance company Consolidar Retiro of Argentina. An additional 24.5% stake in the company Forum Chile was also purchased in September 2011.
In the last quarter of the year, the South American economy continued to grow strongly, supported by resilient domestic demand. Even so, turbulence in Europe and the U.S. has led to greater difficulties in the financial markets in the region, including increased market volatility and a reduction of capital inflows. However, many countries still have a considerable buffer (sounder public finances and better macroeconomic management than in the past) and are in a good position to introduce stimulus policies to counteract weaker foreign demand. In general, a more negative external environment has shifted the focus in emerging countries from overheating to downside risks and, increasingly, to the possible need for support policies. Thus, not only has the cycle of interest-rate rises been halted, but also some countries have actually begun to reduce rates in an effort to stimulate growth.
In terms of exchange rates evolution, there were general gains in the official exchange rates of the main currencies in the region during the quarter. In year-on-year terms, only the Argentinean and Chilean peso lost value. In average terms over the last 12 months all the currencies except for the Chilean peso have weakened. Over the quarter, the variations are not significant. There were minor losses for the Chilean and Colombian peso and gains (also minor) in the remaining currencies. To sum up, the impact of exchange rates over the last year is positive for the balance sheet but negative for earnings. Unless otherwise indicated, all comments below refer to changes at constant exchange rates.
Against this background, the area has maintained its growth levels in both business activity and earnings. The loan book at the end of December amounted to €40,219m, a year-on-year increase of 27.0% and a gain of 10 basis points in market share over the last 12 months (November figures, the latest available). This increase in lending has been accompanied by a significant rise in customer deposits (up 25.7%), focused on
lower-cost transactional current and deposit accounts, which increased over the year by 32.0%. Including the assets under management by mutual funds, customer funds managed by the banks closed December at €48,624m, 23.3% up on the same date in 2010.
From the point of view of earnings, the cumulative net interest income was €3,164m, 31.6% up on the figure for 2010. This reflects the significant growth in business and the good management of spreads, despite strong competitive pressure. Net income from fees and commissions was up 15.7% on the previous year to €1,077m. Net trading income (NTI) was down 3.4% year-on-year to €477m. It was strongly affected by the value of US dollar positions in Banco Provincial in Venezuela and by the turmoil on the markets. As a result of the above, gross income stood at €4,457m, a rise of 21.4% on the figure for 2010.
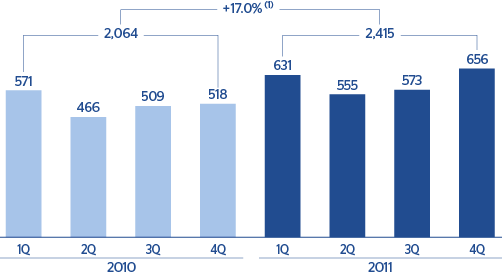
Expenses in the area were strongly influenced by the expansion and differentiation projects carried out in most of the units. As a result, they grew by 27.1% year-on-year to €2,042m, but the efficiency ratio stood at 45.8% thanks to the positive trend in revenues. As a result, operating income was up 17.0% to €2,415m.
The last quarter of the year maintained the same trend in terms of asset quality. The NPA ratio closed on 31-Dec-2011 at 2.2%, with yet again another reduction over the quarter of 10 basis points thanks to the rigorous policy of risk admission and the outstanding management of recoveries policy. The coverage ratio improved considerably again this quarter to 146%. The increase in lending in the area explains the 10.5% year-on-year rise in impairment losses on financial assets to €449m.
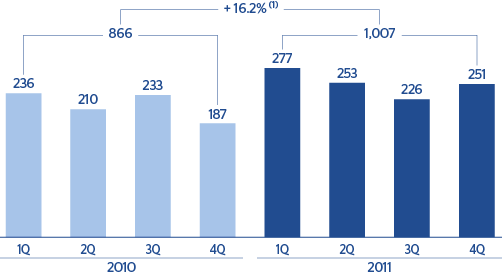
In short, the excellent growth of revenues thanks to the boost provided by business combined with good price management has enabled the Bank to continue with its investment effort in the area, increase loan-loss provisions due to the growing lending volumes and achieve a net attributable profit of €1,007m, a rise of 16.2% over the year.