
Mexico highlights in the fourth quarter
- Net interest income growth.
- Positive contribution from the insurance business.
- Efficiency ratio at 36.2%.
- Leadership position in transparency and sustainability.
This area comprises the banking, pensions and insurance business conducted in Mexico by the BBVA Bancomer Financial Group (hereinafter, BBVA Bancomer).
In 2011, the Mexican economy continued its recovery that began in mid-2009, with expected growth for the year at 3.8%. This increase is mainly due to domestic factors. Of note are its solid performance in private demand, stability in the rate of job creation in the formal sector, as well as the incipient improvement in real wage growth, which has contributed decisively to maintaining the rate of private consumption.
This sustained improvement has not generated inflationary pressures, as the increase in the national consumer price index (INPC) in 2011 was 3.4%, approximately one percentage point less than in 2010. The Bank of Mexico has thus been able to continue with its monetary policy in force since mid-2009, and maintained the lending rate at 4.5%.
With respect to currency movements over the year, the official rate of the Mexican peso lost 8.3% against the euro year-on-year. Thus the impact of the currency on the balance sheet and business activity in the area is negative. There was also depreciation in terms of average exchange rates, although in this case to a lesser extent (down 3.2% year-on-year). Thus, the effect of the currency on the income statement was also negative. Over the quarter, the influence of the peso has been positive on the balance sheet and business activity, but negative on earnings. Unless otherwise indicated, all comments below refer to changes at constant exchange rate.
Over the years, Mexico has developed clear strengths in terms of the definition and implementation of its monetary and fiscal policies and prudent regulatory measures, which are especially important in matters such as the soundness of the Mexican banking system.
In 2011, BBVA Bancomer achieved earnings figures that set it apart from its main competitors. Net interest income was €3,827m, 7.2% up on the previous year, due to increased business activity and good price management. This has offset the effect of low interest rates and the reduced contribution from global business. In terms of profitability, net interest income over average total assets demonstrated great stability over the past year. Income from fees and commissions remained at the same level as the previous year, at €1,194m. The performance of asset management fees (investment companies and pension funds) was able to offset the less favorable evolution of banking fees influenced by regulatory changes. The situation of the financial markets, especially in the last part of the year has led to lower brokerage revenues. As a consequence, NTI registered a fall of 20.9% year-on-year at the close of 2011 to €302m. Finally, other income and expenses totaled €227m, up 31.0% year-on-year, boosted mainly by activity in the insurance business. As a result of the above, gross income reached €5,550m, 4.3% higher than the figure for 2010.
Operating expenses stood at €2,012m, 9.4% up on the figure for 2010. This is the result of BBVA Bancomer’s investment in infrastructure, innovation and technology to take advantage of the growth opportunities in the Mexican market. Over the course of 2011, its distribution network grew by 14 additional branches, 950 ATMs and 20,300 POS. The efficiency ratio stood at 36.2%, confirming that BBVA Bancomer is one of the most efficient banks in the Mexican banking system.
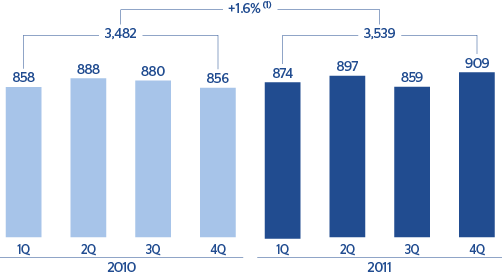
With these evolutions of revenue and expenses, the operating income amounted to €3,539m, which is 1.6% above the figure achieved in 2010.
Lending growth has been accompanied by adequate risk management. This has enabled impairment losses on financial assets to remain at similar levels to those of the previous year, while the accumulated risk premium has improved by 36 basis points over the year to 3.29%. The NPA and coverage ratios closed the year at 3.5% and 120% respectively.
As a result of the above, the area’s net attributable profit reached €1,741m, 5.4% up on the previous year. It is worth noting that BBVA Bancomer closed 2011 with a ROE of 20% (according to local accounting criteria), making it one of the most profitable entities in the Mexican banking system.