
Spain
Highlights for the period January - March 2026
- Investment growth, driven by business and consumer lending
- Favorable performance of recurring revenues and NTI
- Improvement of NPL ratio and NPL coverage ratio
- Year-on-year growth in net attributable profit, which remains above €1 billion
BUSINESS ACTIVITY (1)
(VARIATION COMPARED TO 31-12-25)
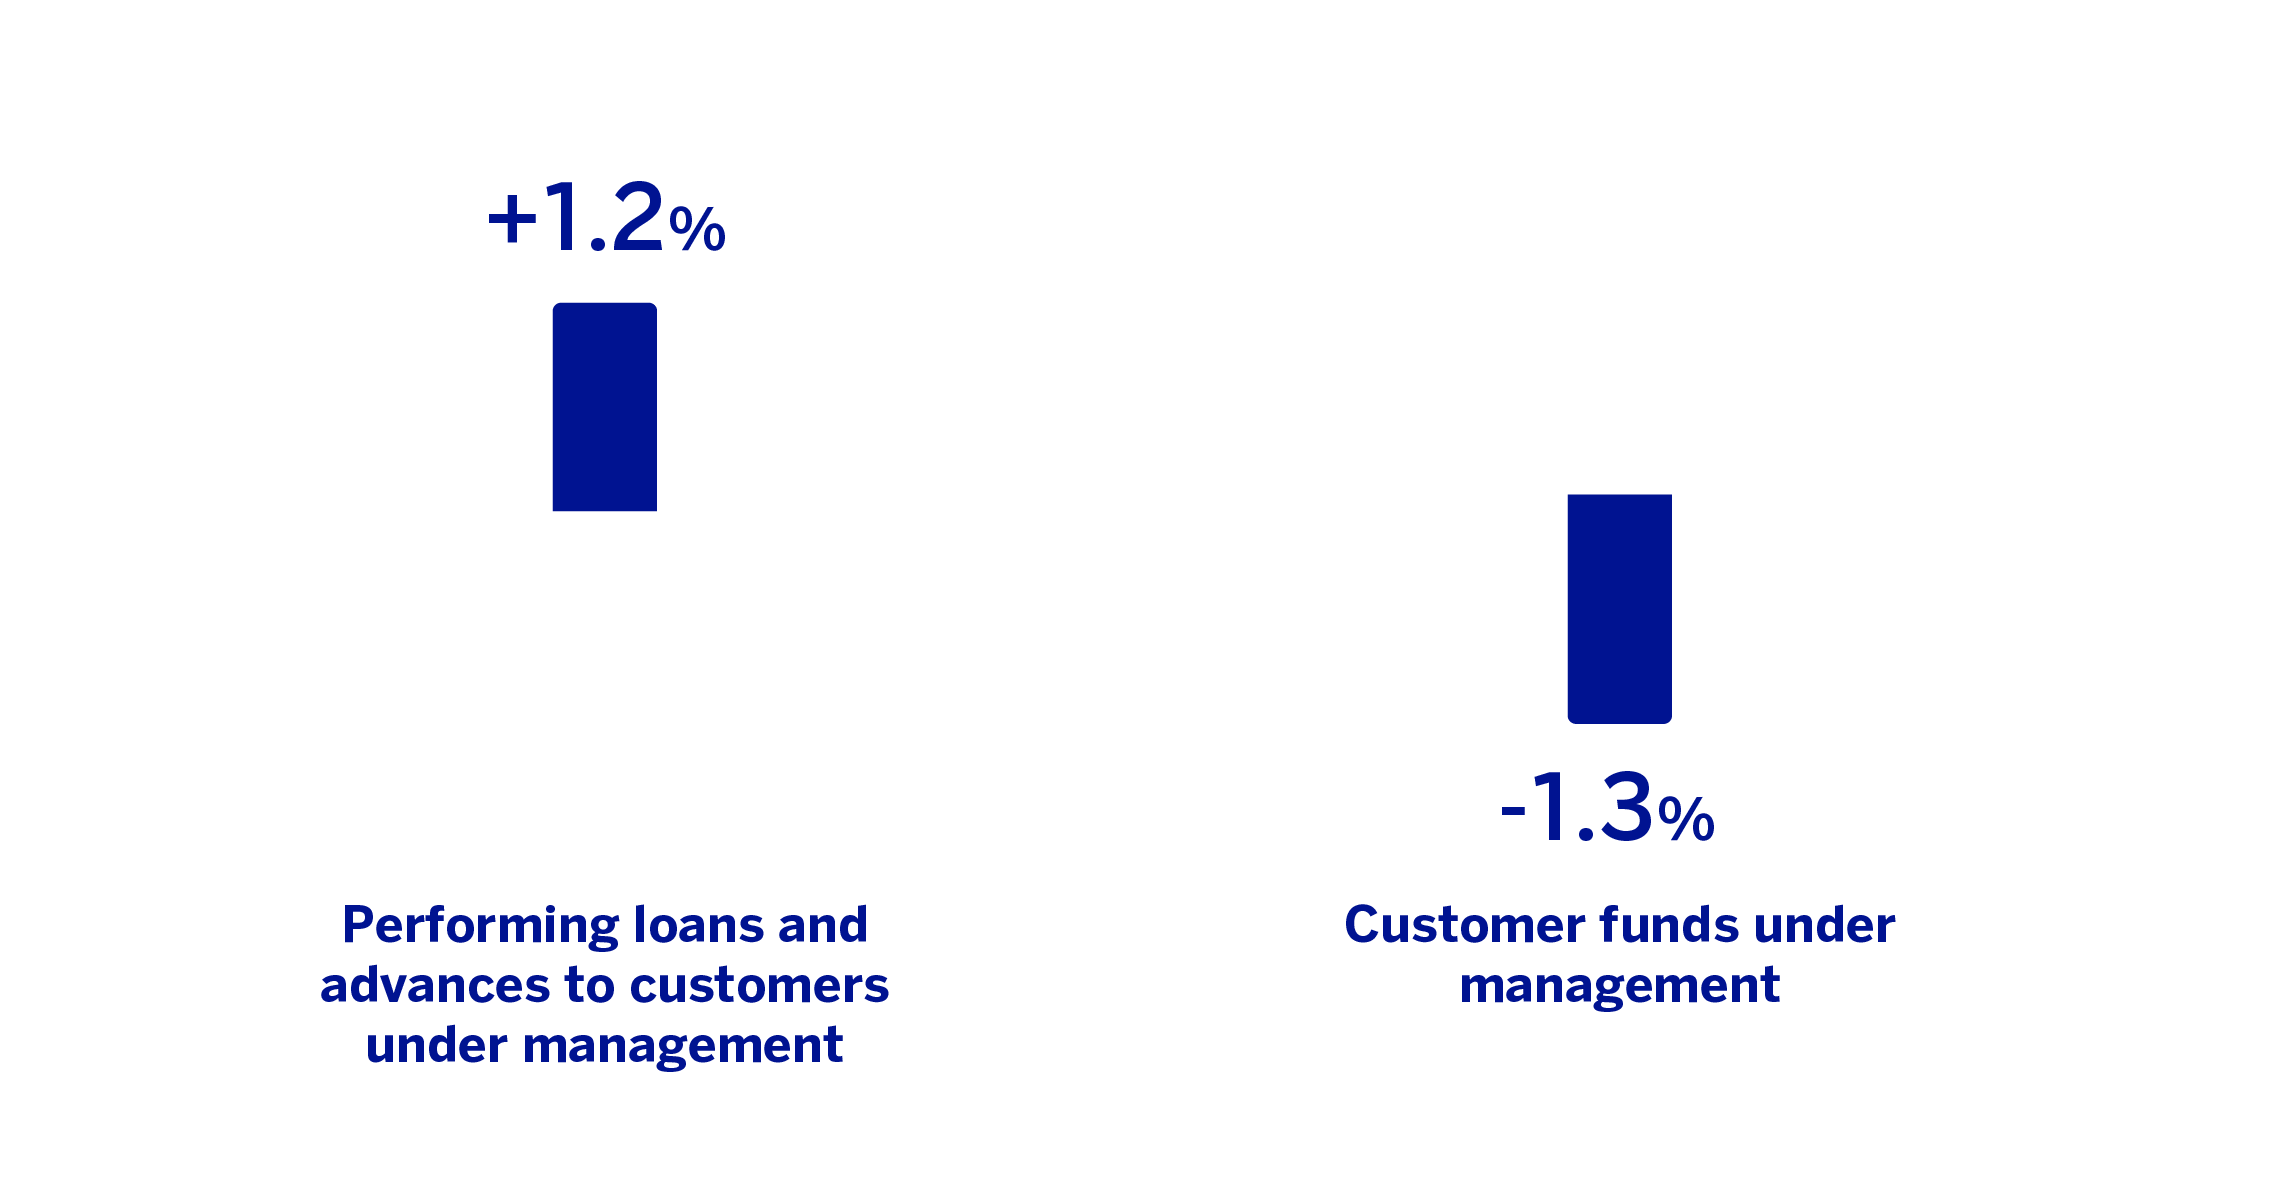
(1) Excluding repos.
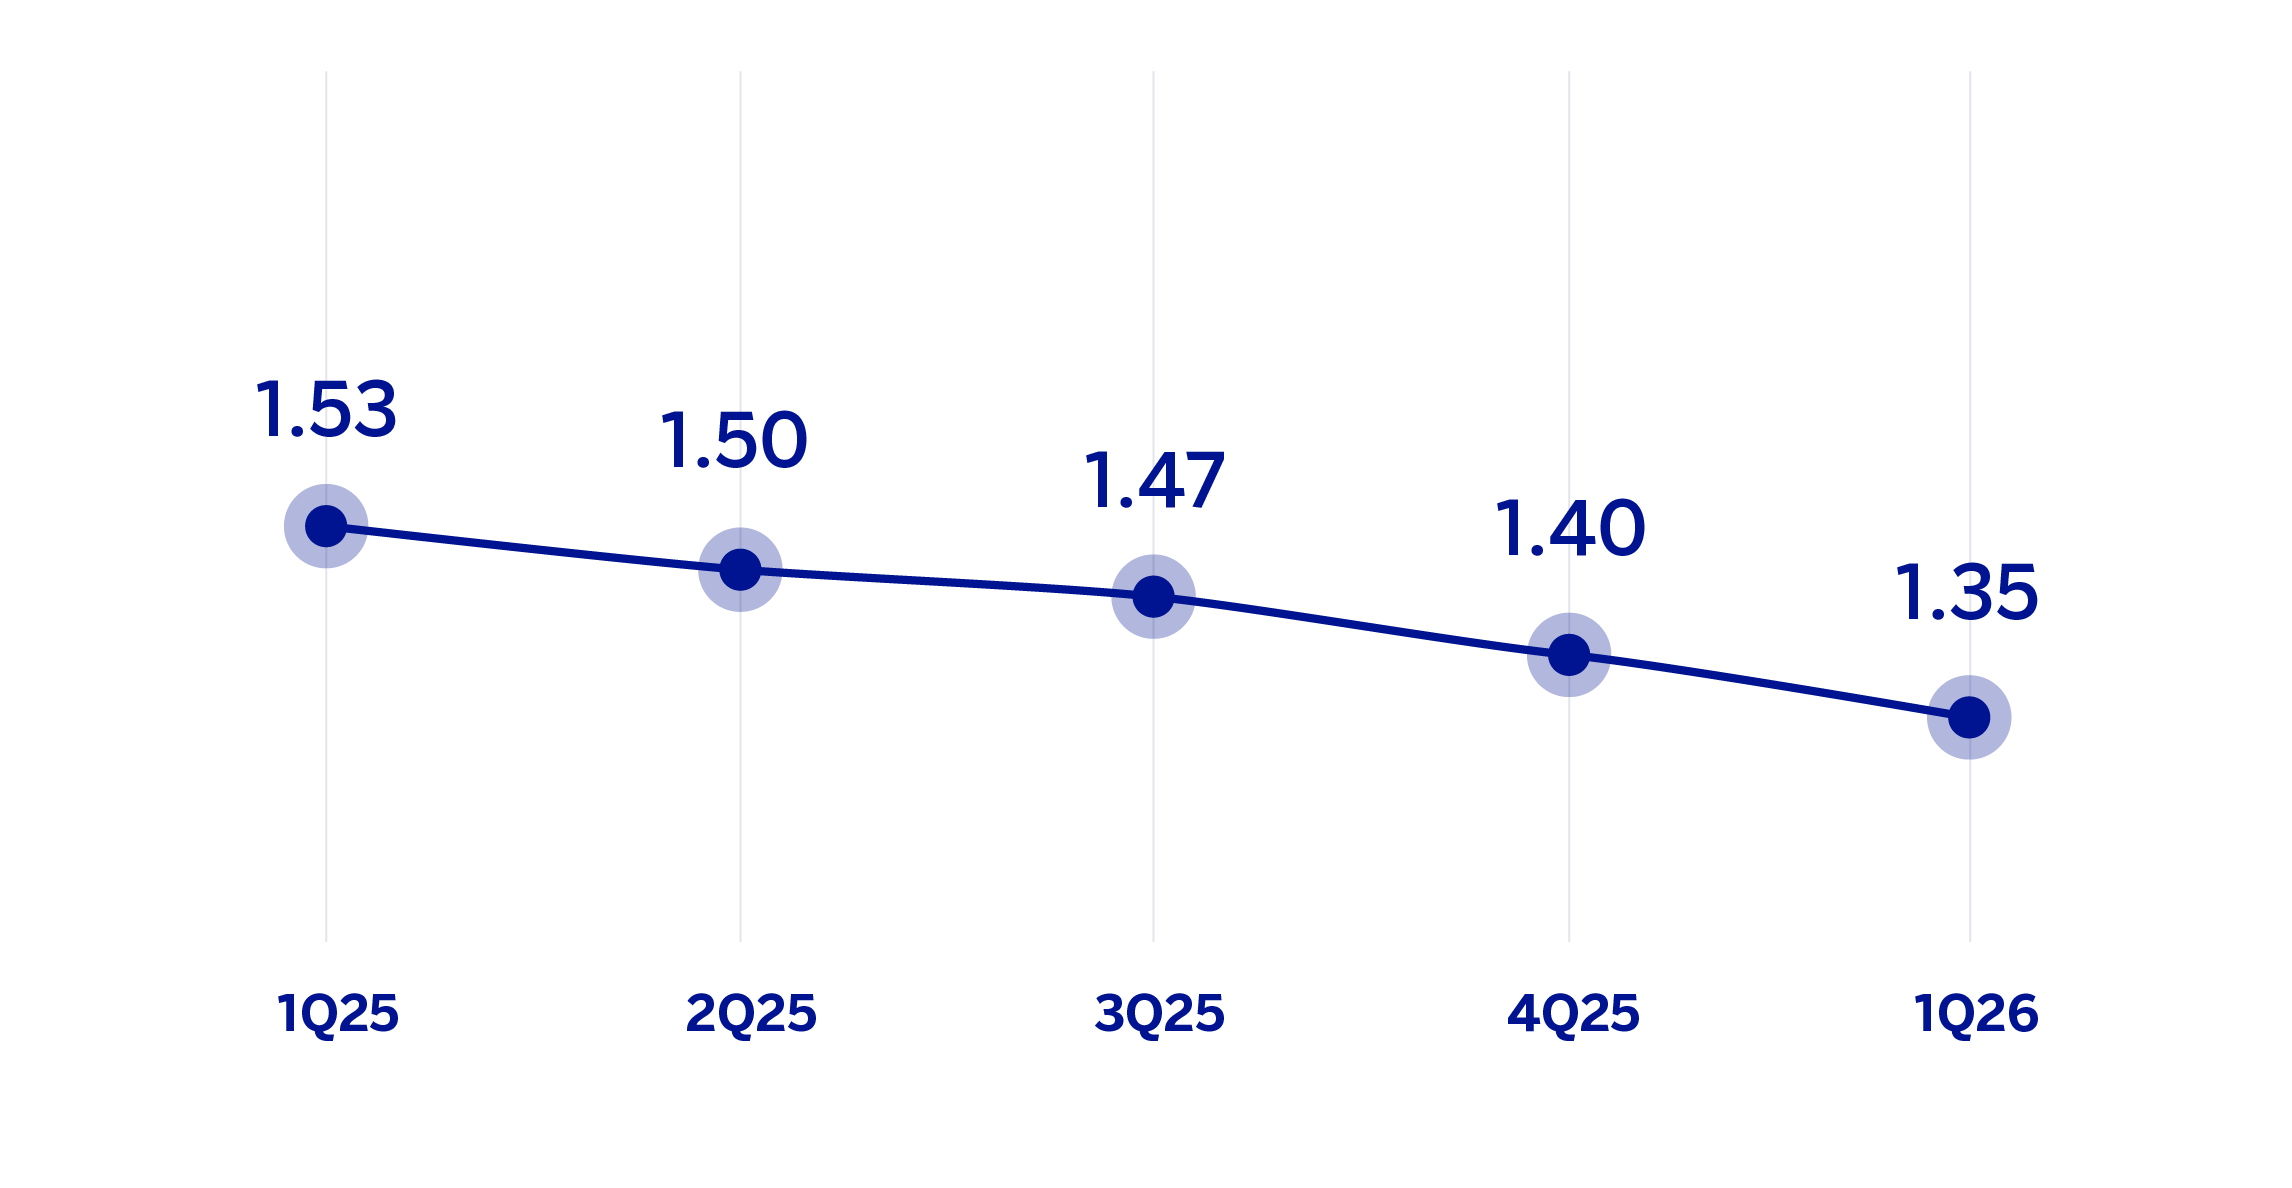
NET INTEREST INCOME / AVERAGE TOTAL ASSETS
(PERCENTAGE)
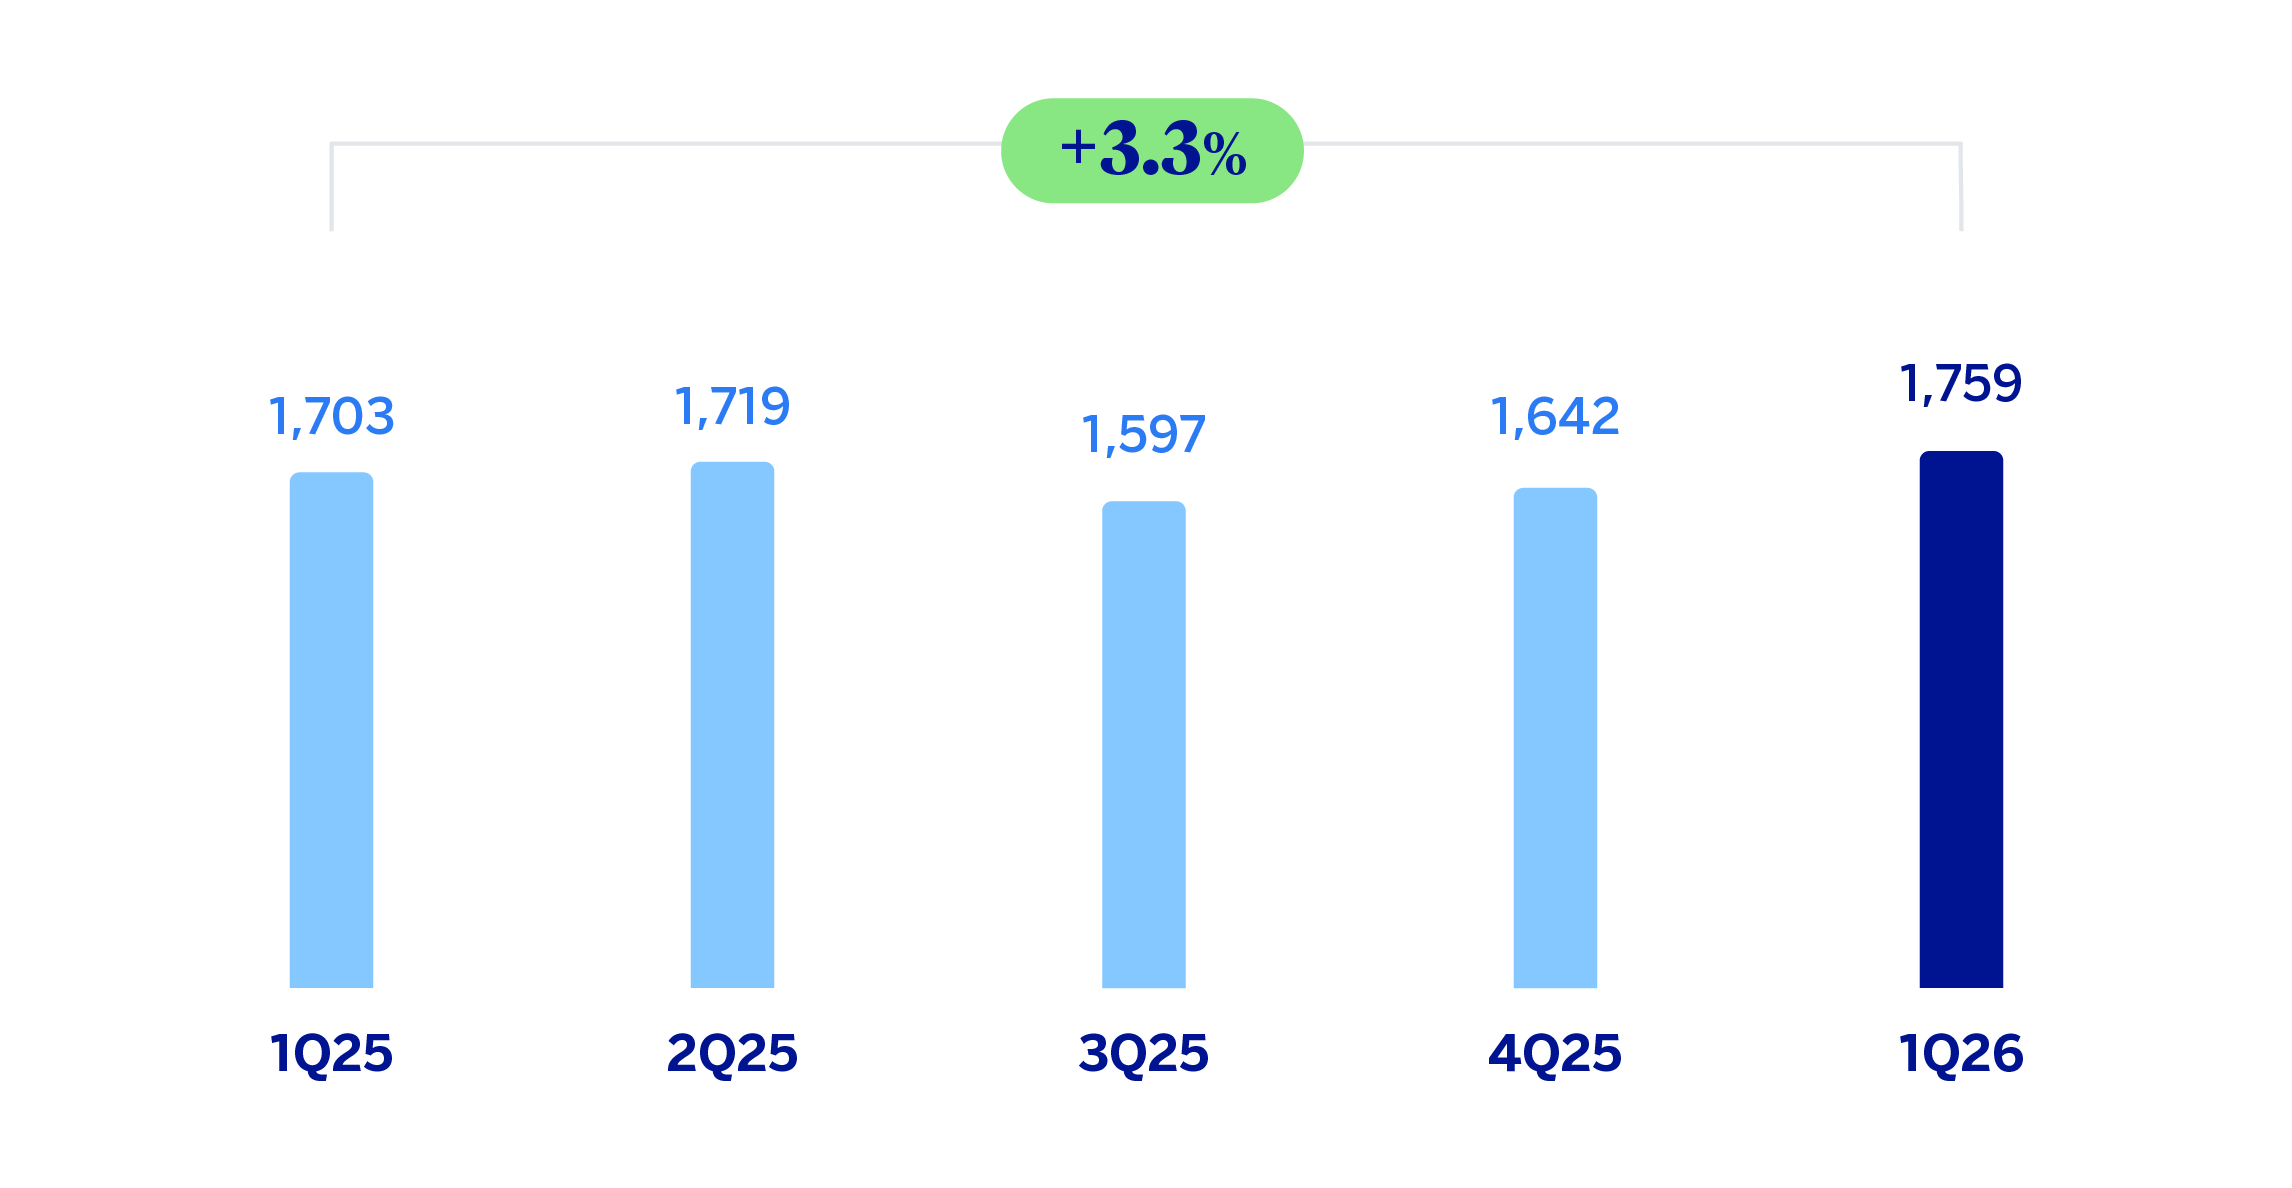
OPERATING INCOME (MILLIONS OF EUROS)
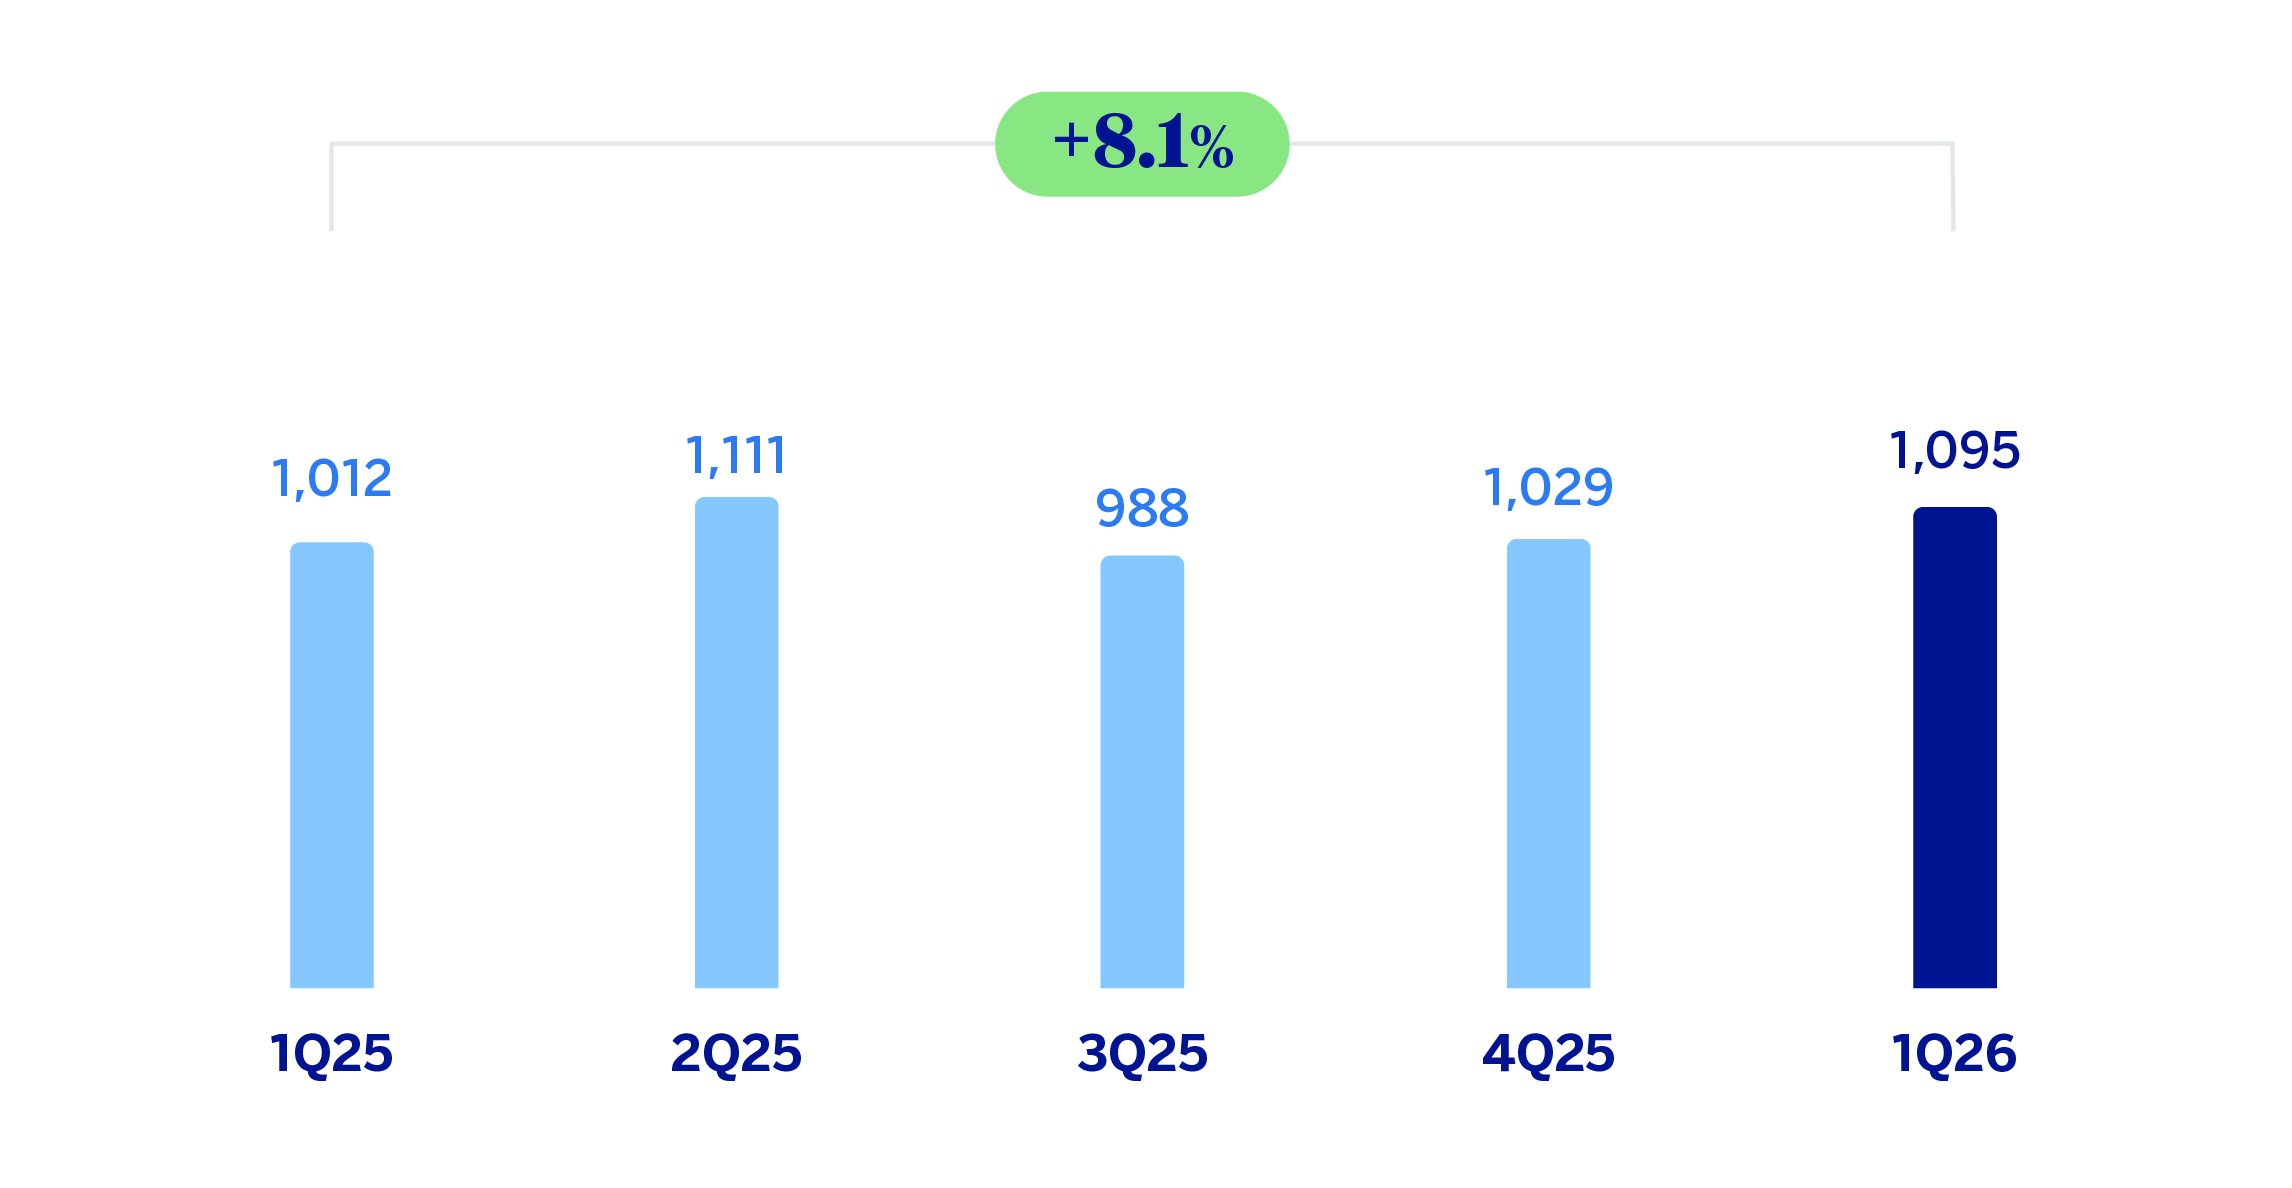
NET ATTRIBUTABLE PROFIT (LOSS) (MILLIONS OF EUROS)
| FINANCIAL STATEMENTS AND RELEVANT BUSINESS INDICATORS (MILLIONS OF EUROS AND PERCENTAGE) | |||
|---|---|---|---|
| Income statement | 1Q26 | 𝚫 % | 1Q25 (1) |
| Net interest income | 1,656 | 3.6 | 1,598 |
| Net fees and commissions | 605 | 3.5 | 584 |
| Net trading income | 295 | 20.0 | 246 |
| Other operating income and expenses | 97 | 8.4 | 89 |
| Of which: Insurance activities | 107 | 3.3 | 103 |
| Gross income | 2,653 | 5.4 | 2,518 |
| Operating expenses | (894) | 9.7 | (815) |
| Personnel expenses | (495) | 14.8 | (431) |
| Other administrative expenses | (297) | 1.9 | (292) |
| Depreciation | (102) | 10.2 | (93) |
| Operating income | 1,759 | 3.3 | 1,703 |
| Impairment on financial assets not measured at fair value through profit or loss | (165) | 19.4 | (139) |
| Provisions or reversal of provisions and other results | (18) | (28.1) | (26) |
| Profit (loss) before tax | 1,575 | 2.4 | 1,538 |
| Income tax | (480) | (8.7) | (525) |
| Profit (loss) for the period | 1,096 | 8.1 | 1,013 |
| Non-controlling interests | (1) | 3.2 | (1) |
| Net attributable profit (loss) excluding non-recurring impacts | 1,095 | 8.1 | 1,012 |
| Balance sheets | 31-03-26 | 𝚫 % | 31-12-25 (1) |
| Cash, cash balances at central banks and other demand deposits | 11,503 | (42.3) | 19,929 |
| Financial assets designated at fair value | 134,513 | 12.2 | 119,910 |
| Of which: Loans and advances | 51,501 | 18.8 | 43,346 |
| Financial assets at amortized cost | 268,949 | 2.1 | 263,437 |
| Of which: Loans and advances to customers | 195,110 | 1.1 | 192,959 |
| Inter-area positions | 52,706 | 9.1 | 48,288 |
| Tangible assets | 2,692 | (1.0) | 2,718 |
| Other assets | 4,003 | 5.1 | 3,808 |
| Total assets/liabilities and equity | 474,365 | 3.6 | 458,090 |
| Financial liabilities held for trading and designated at fair value through profit or loss | 95,873 | 15.8 | 82,785 |
| Deposits from central banks and credit institutions | 37,671 | 8.9 | 34,582 |
| Deposits from customers | 248,520 | (1.2) | 251,430 |
| Debt certificates | 59,147 | 11.0 | 53,300 |
| Inter-area positions | — | — | — |
| Other liabilities | 17,679 | (15.1) | 20,822 |
| Allocated regulatory capital | 15,474 | 2.0 | 15,171 |
| Relevant business indicators | 31-03-26 | 𝚫 % | 31-12-25 |
| Performing loans and advances to customers under management (2) | 193,253 | 1.2 | 190,943 |
| Non-performing loans | 6,597 | (2.4) | 6,759 |
| Customer deposits under management (1)(2) | 234,205 | (1.8) | 238,447 |
| Off-balance sheet funds (1)(3) | 117,752 | (1.7) | 119,535 |
| Risk-weighted assets (1) | 69,148 | (42.2) | 119,734 |
| RORWA (4) | 3.7 | 3.4 | |
| Efficiency ratio (%) | 33.7 | 33.3 | |
| NPL ratio (%) | 2.9 | 3.0 | |
| NPL coverage ratio (%) | 69 | 67 | |
| Cost of risk (%) | 0.34 | 0.34 | |
| (1) Revised balances. For more information, please refer to the “Business Areas” section. (2) Excluding repos. (3) Includes mutual funds, customer portfolios and pension funds. (4) For more information on the calculation methodology, as well as the calculation of the metric at the consolidated Group level, see Alternative Performance Measures at this report. |
|||
Macro and industry trends
The dynamism of economic activity has remained solid during the fourth quarter of 2025 and forward-looking growth expectations continue to be favorable according to the information available for the first months of 2026. The advance in employment and private consumption, the recovery in investment, and the resilience of service exports are expected to continue supporting activity throughout the year. The fiscal support measures adopted to overcome the effects of the conflict in Iran, together with the acceleration of European recovery funds and the increase in defense spending, could also continue to boost domestic demand.
Nevertheless, BBVA Research maintains its forecast of a gradual moderation in growth for 2026 to 2.4%, compared to the 2.8% observed the previous year. The context of geopolitical instability and protectionism at a global level, the limited advances in productivity, and supply restrictions in key sectors such as housing, energy and infrastructure would explain this deceleration. For its part, headline inflation rebounded in March to 3.4%, after standing at 2.3% in the first 2 months of the year, as a consequence of the increase in fuel prices. It is expected to remain above 3% until mid-2026 and moderate slightly thereafter to close the year at 2.7%.
As for the banking system, with data at the end of February 2026, the volume of credit to the private sector grew by 3.9% year-on-year, with higher growth in the portfolios of credit to households (+4.8%) than in credit to non-financial companies (+2.9%). Customer deposits grew by 6.3% year-on-year in February 2026, due to an 8.0% increase in demand deposits, which more than offsets the reduction of 2.6% in time deposits. The NPL ratio stood at 2.7% in January 2026, 62 basis points lower than in January of last year. It should also be noted that the system maintains comfortable levels of solvency and liquidity.
Activity
The most relevant aspects related to the area's activity during the first quarter of 2026 were:
Lending activity increased by 1.2% compared to the end of December, favored mainly by the performance of credit to companies (+2.7%), followed by consumer lending (+2.6%).
Regarding asset quality, the NPL ratio stood at 2.9%, with a decrease of 11 basis points compared to the end of December, driven by the evolution of activity and the decrease of non-performing loans, concentrated in mortgages. In addition, there was a strong portfolio dynamism and portfolio sales carried out in the quarter, contributing to an increase in the NPL coverage ratio by 190 basis points in the quarter, to 69% at the end of March 2025.
Total customer funds decreased overall by 1.3% in the first quarter of 2026, affected by the traditional seasonality of the quarter, which involves a reduction in customer deposits, mainly due to lower time deposit balances (-7.7%) and a negative market effect on off-balance sheet funds which causes them to show a reduction compared to the end of the previous year (-0.5%).
Results
Spain generated a net attributable profit of €1,095 million in the first quarter of 2026, which is 8.1% above the result achieved in the same period of 2025, driven by the evolution of recurring revenues and NTI.
The most relevant aspects of the year-on-year evolution of the area's income statement at the end of March 2026 were:
Net interest income grew by 3.6%, supported by the higher contribution from the securities portfolio and higher lending balances.
Net fees and commissions grew by 3.5% compared to the same period of the previous year, driven primarily by the performance of asset management fees and those from the relationship with wholesale customers.
Net Trading Income (NTI) recorded a growth of 20.0% compared to that achieved in the first quarter of the previous year, favored by the performance of the insurance portfolio and portfolio sales made in the quarter.
The other operating income and expenses line performed favorably, with a growth of 8.4% as a result of the favorable performance of the insurance business.
Operating expenses increased by 9.7% compared to the first quarter of 2025, due to both higher general expenses (mainly in technology) and personnel expenses, the latter reflecting the impact of the voluntary redundancies in the first quarter of 2026.
The impairment on financial assets increased by 19.4%, primarily due to the different dynamics of the macroeconomic scenarios between both periods, in a context of greater uncertainty in the current environment. Meanwhile, the cumulative cost of risk at the end of March 2026 remained stable compared to December 2025 and the quarterly total, standing at 0.34%.
Finally, the income tax line includes the accrual corresponding to the first quarter of 2026, of the tax on net interest income and net fees and commissions that have amounted to approximately €81 million, in line with the €85 million euros accrued in the same period of the previous year.
Read legal disclaimer of this report.