
South America
Highlights for the period January - March 2026
- Growth in lending activity and customer funds
- Favorable evolution of the net interest income in Argentina, Colombia and Peru
- Greater adjustment for hyperinflation compared to March 2025
- Year-on-year increase in the area's net attributable profit, driven by Colombia
BUSINESS ACTIVITY (1) (VARIATION AT CONSTANT EXCHANGE RATES COMPARED TO 31-12-25)
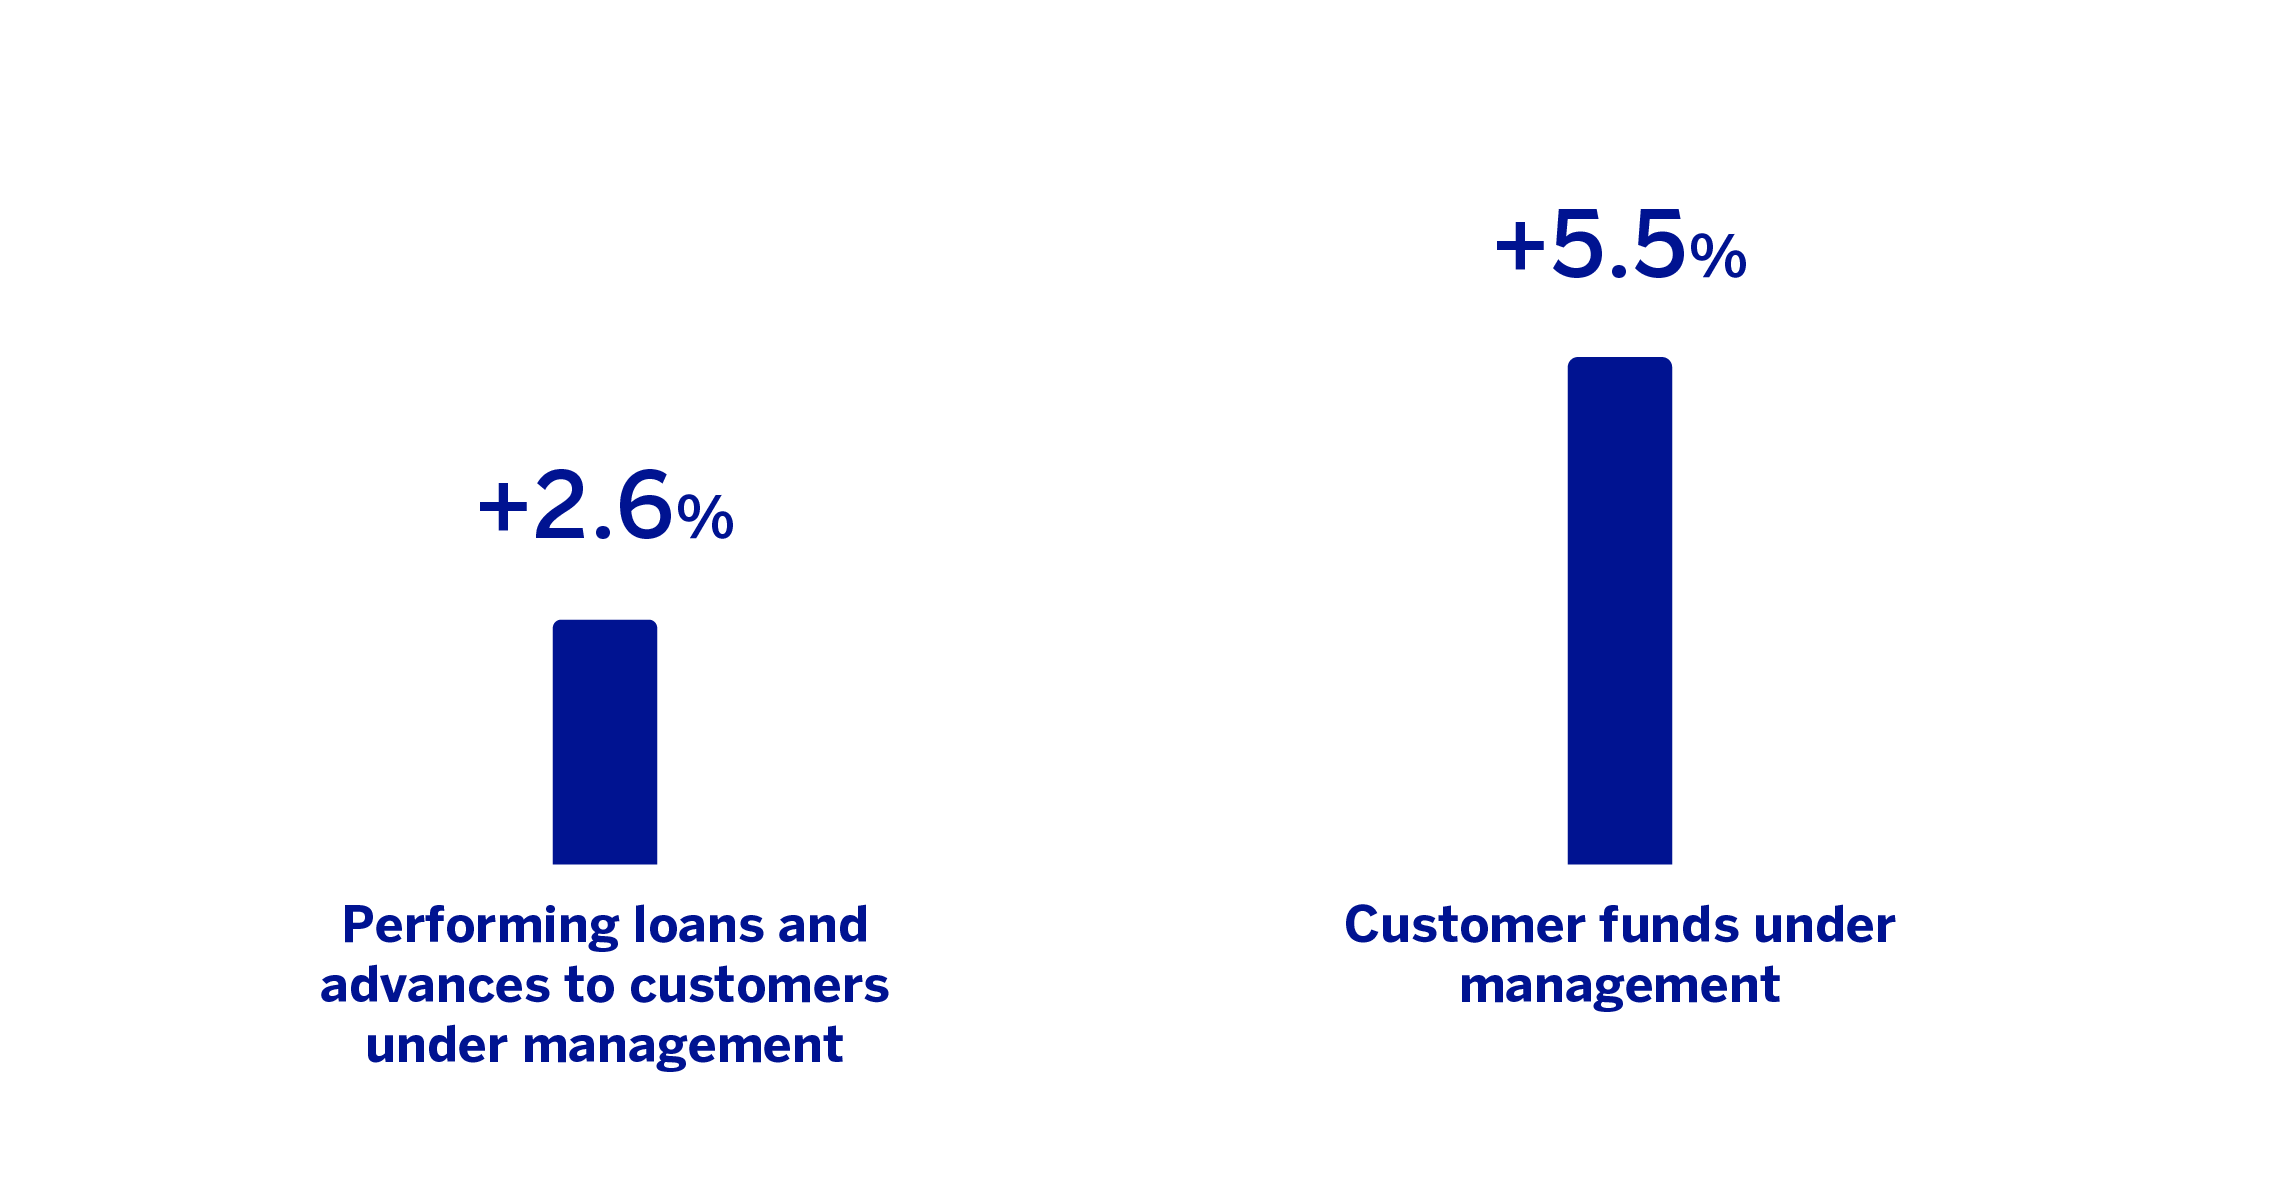
(1) Excluding repos.
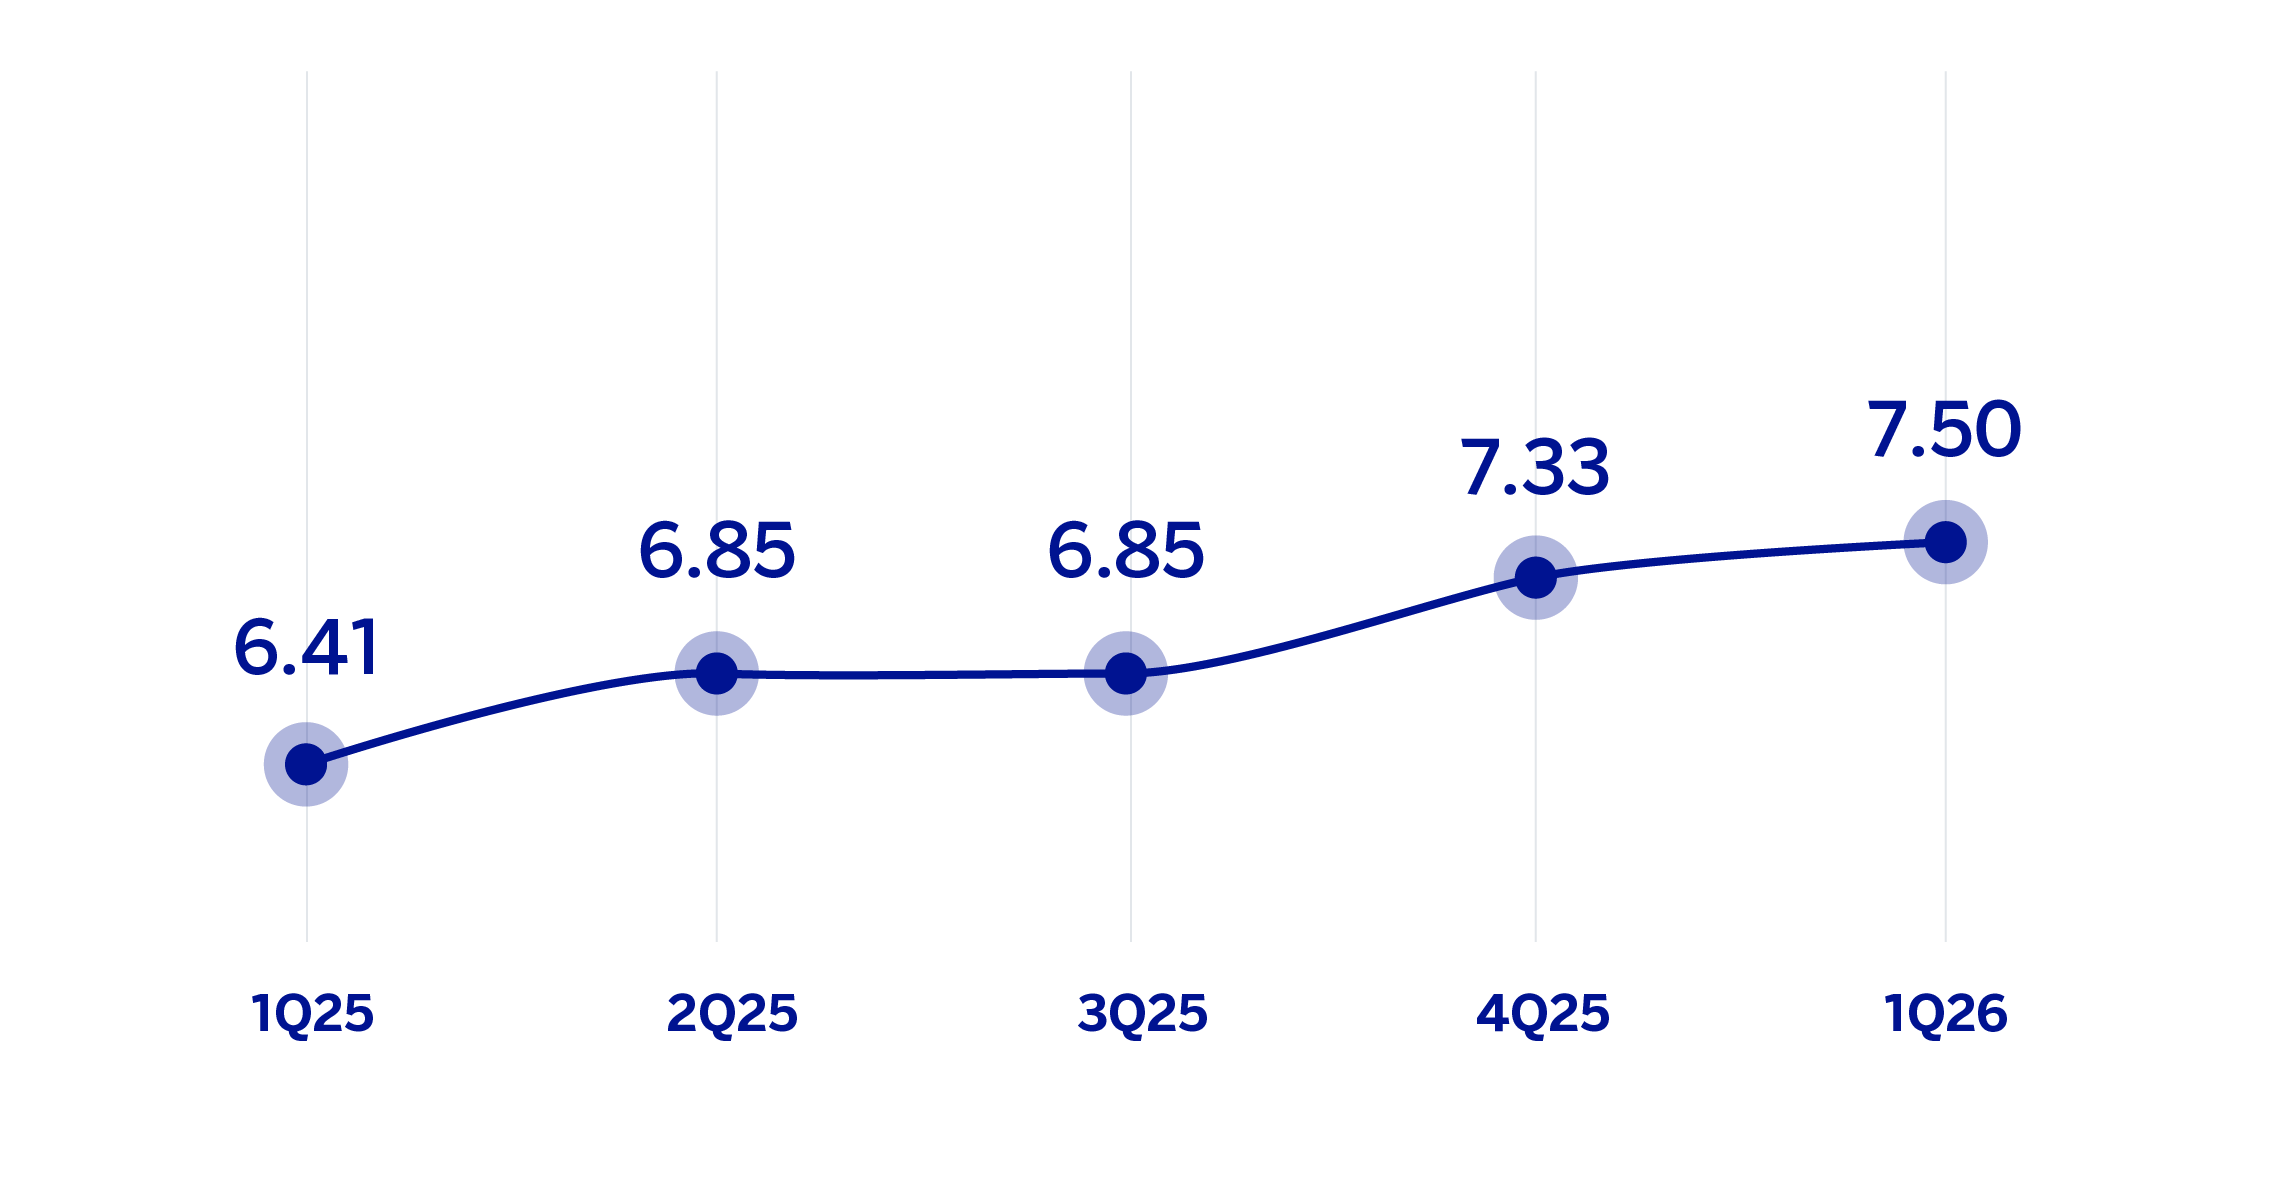
NET INTEREST INCOME / AVERAGE TOTAL ASSETS
(PERCENTAGE AT CONSTANT EXCHANGE RATES)
OPERATING INCOME
(MILLIONS OF EUROS AT CURRENT EXCHANGE RATES)
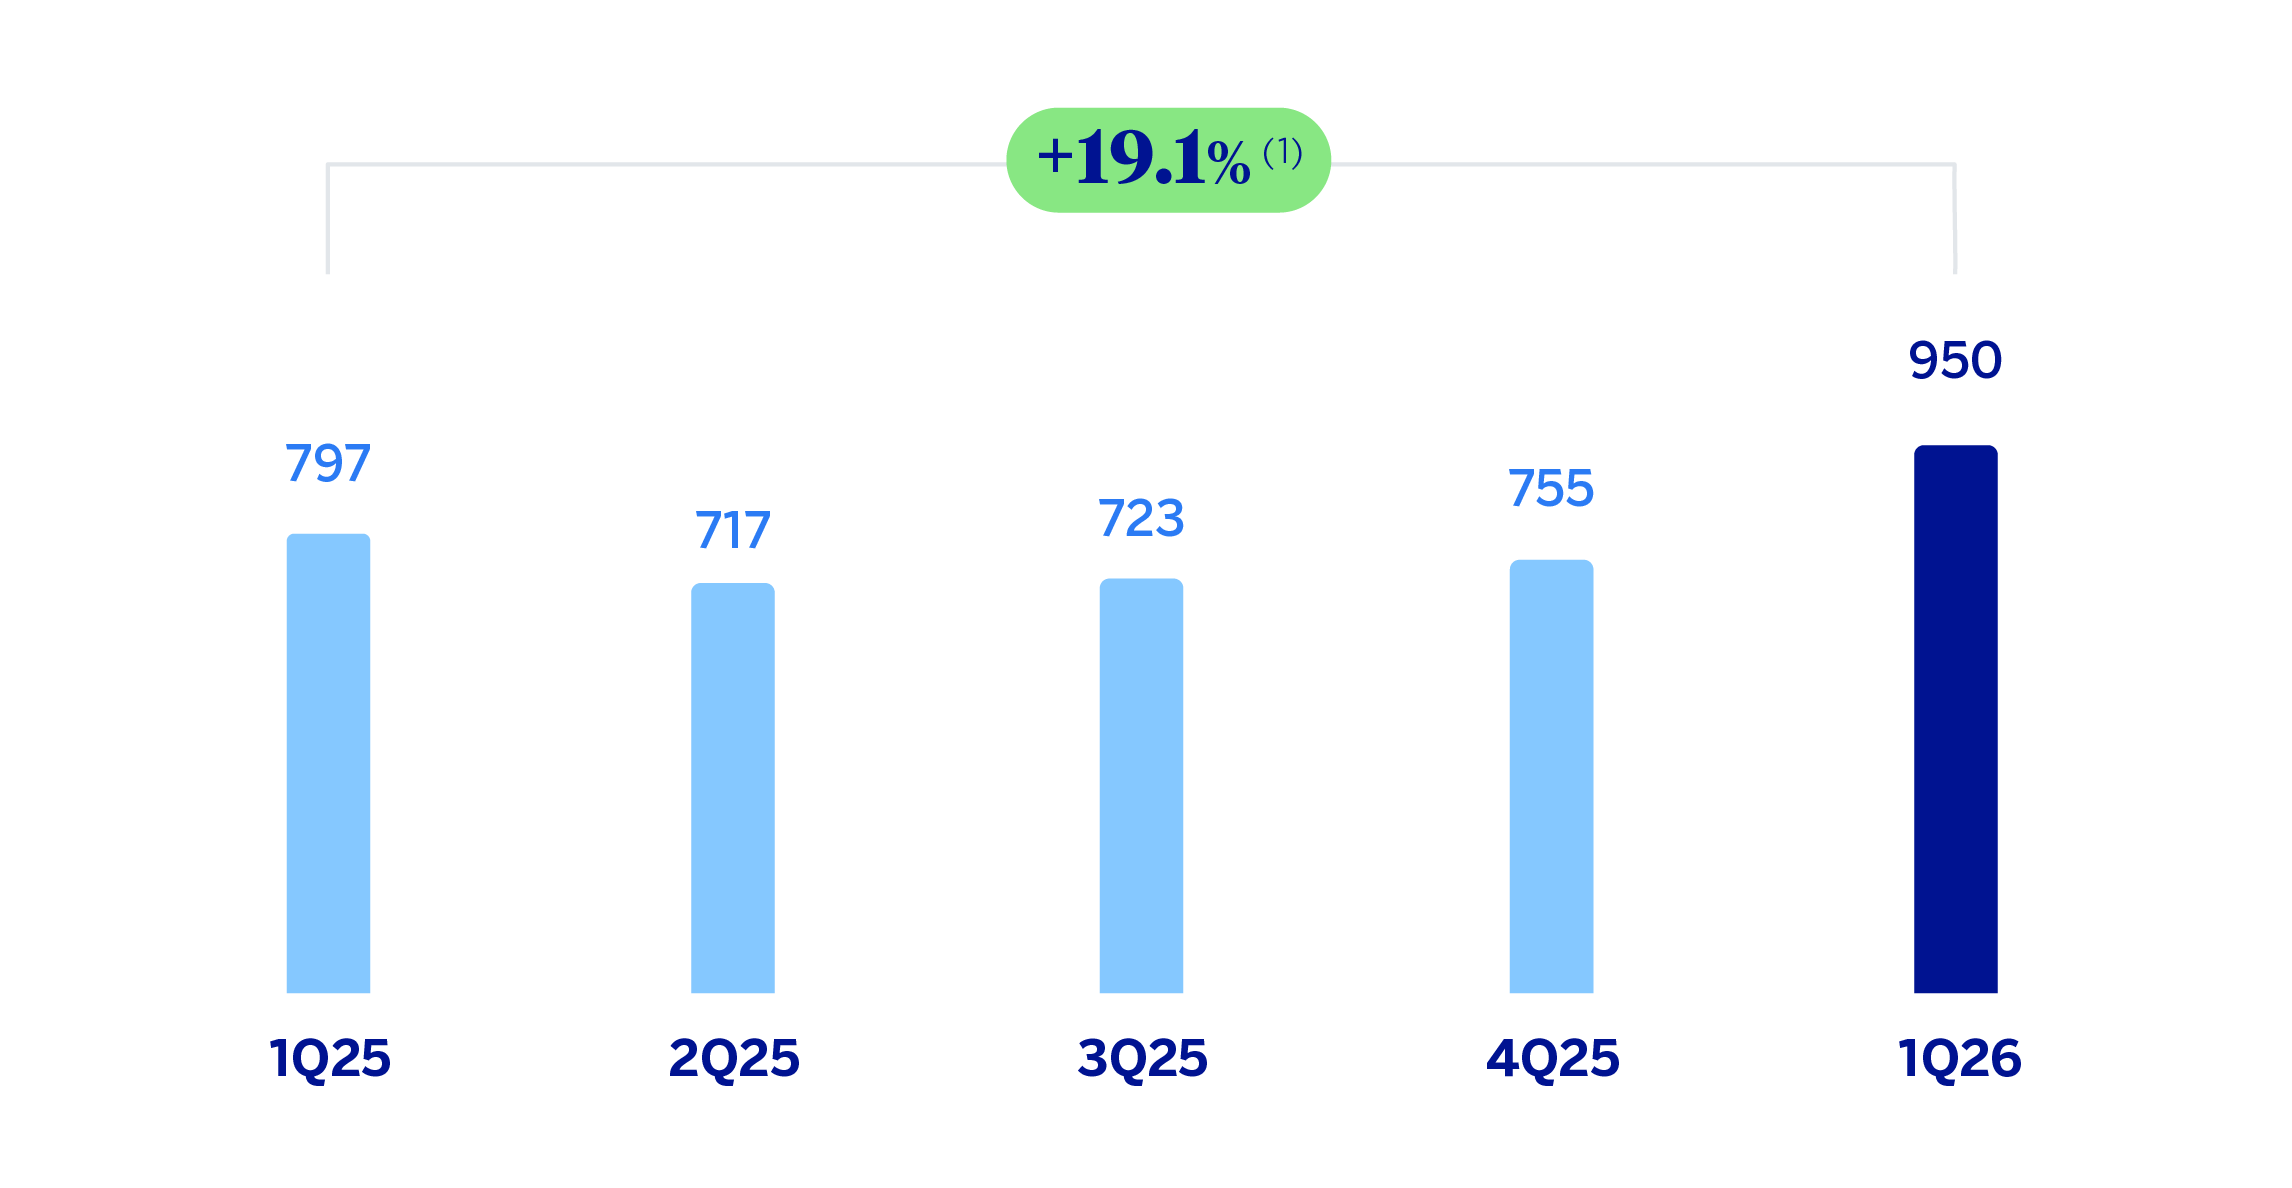
(1) At constant exchange rates: +34.5%.
NET ATTRIBUTABLE PROFIT (LOSS)
(MILLIONS OF EUROS AT CURRENT EXCHANGE RATES)
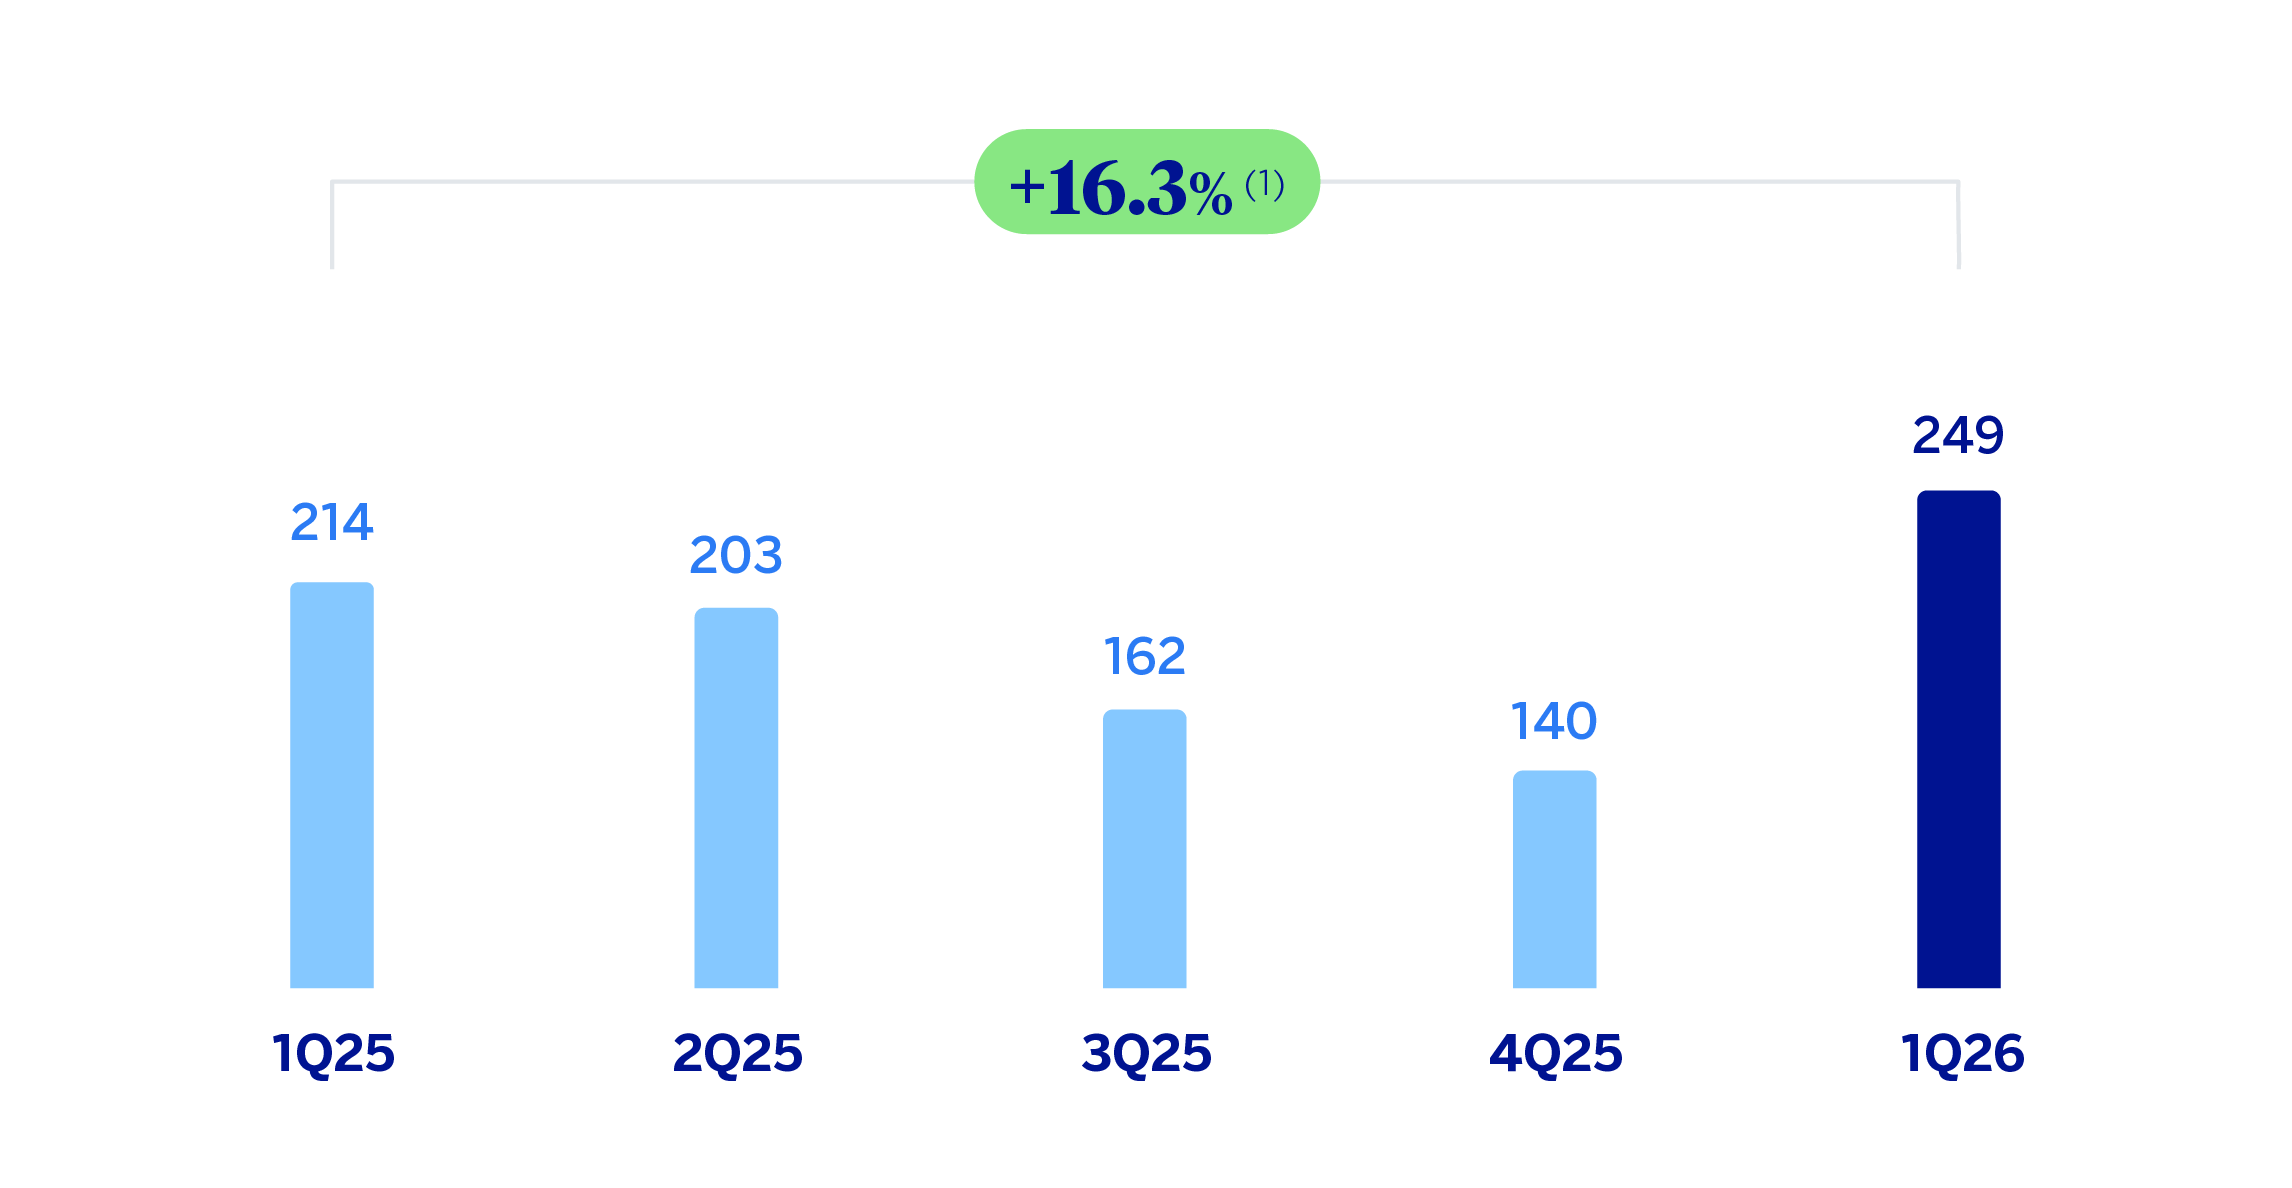
(1) At constant exchange rates: +33.8%.
| FINANCIAL STATEMENTS AND RELEVANT BUSINESS INDICATORS (MILLIONS OF EUROS AND PERCENTAGE) | ||||
|---|---|---|---|---|
| Income statement | 1Q26 | 𝚫 % | 𝚫 % (1) | 1Q25 (2) |
| Net interest income | 1,474 | 19.7 | 33.4 | 1,232 |
| Net fees and commissions | 263 | 15.7 | 30.1 | 227 |
| Net trading income | 145 | (23.0) | (12.6) | 188 |
| Other operating income and expenses | (256) | 23.1 | 35.2 | (208) |
| Gross income | 1,626 | 13.0 | 26.6 | 1,439 |
| Operating expenses | (677) | 5.4 | 17.0 | (642) |
| Personnel expenses | (307) | 10.2 | 23.4 | (278) |
| Other administrative expenses | (310) | 0.6 | 12.2 | (308) |
| Depreciation | (60) | 8.1 | 12.1 | (55) |
| Operating income | 950 | 19.1 | 34.5 | 797 |
| Impairment on financial assets not measured at fair value through profit or loss | (371) | 25.2 | 36.4 | (297) |
| Provisions or reversal of provisions and other results | (18) | n.s. | n.s. | 6 |
| Profit (loss) before tax | 561 | 10.6 | 27.1 | 507 |
| Income tax | (170) | 15.4 | 35.7 | (147) |
| Profit (loss) for the period | 391 | 8.6 | 23.6 | 360 |
| Non-controlling interests | (142) | (2.7) | 9.1 | (146) |
| Net attributable profit (loss) | 249 | 16.3 | 33.8 | 214 |
| Balance sheets | 31-03-26 | 𝚫 % | 𝚫 % (1) | 31-12-25 (2) |
| Cash, cash balances at central banks and other demand deposits | 8,279 | 2.6 | (0.1) | 8,073 |
| Financial assets designated at fair value | 11,665 | 10.0 | 7.5 | 10,602 |
| Of which: Loans and advances | 248 | (16.4) | (20.1) | 297 |
| Financial assets at amortized cost | 57,431 | 5.8 | 3.8 | 54,283 |
| Of which: Loans and advances to customers | 53,644 | 4.7 | 2.8 | 51,235 |
| Tangible assets | 1,241 | 8.0 | 7.4 | 1,149 |
| Other assets | 2,486 | (1.2) | (6.3) | 2,517 |
| Total assets/liabilities and equity | 81,103 | 5.8 | 3.6 | 76,624 |
| Financial liabilities held for trading and designated at fair value through profit or loss | 2,531 | 4.2 | 0.2 | 2,430 |
| Deposits from central banks and credit institutions | 3,383 | (11.6) | (12.6) | 3,826 |
| Deposits from customers | 56,996 | 6.8 | 4.6 | 53,375 |
| Debt certificates | 4,112 | 2.4 | 0.4 | 4,015 |
| Other liabilities | 6,692 | 17.3 | 14.2 | 5,707 |
| Allocated regulatory capital | 7,389 | 1.6 | (0.6) | 7,271 |
| Relevant business indicators | 31-03-26 | 𝚫 % | 𝚫 % (1) | 31-12-25 |
| Performing loans and advances to customers under management (3) | 52,857 | 4.5 | 2.6 | 50,566 |
| Non-performing loans | 2,497 | 7.9 | 5.7 | 2,314 |
| Customer deposits under management (4) | 56,996 | 6.8 | 4.6 | 53,375 |
| Off-balance sheet funds (5) | 9,454 | 14.3 | 11.3 | 8,271 |
| Risk-weighted assets | 59,235 | 5.9 | 3.7 | 55,912 |
| RORWA (6) | 2.7 | 2.1 | ||
| Efficiency ratio (%) | 41.6 | 44.4 | ||
| NPL ratio (%) | 4.2 | 4.0 | ||
| NPL coverage ratio (%) | 90 | 92 | ||
| Cost of risk (%) | 2.76 | 2.50 | ||
| (1) At constant exchange rate. (2) Revised balances. For more information, please refer to the “Business Areas” section. (3) Excluding repos. (4) Excluding repos and including specific marketable debt securities. (5) Includes mutual funds and customer portfolios in Colombia and Peru. (6) For more information on the calculation methodology, as well as the calculation of the metric at the consolidated Group level, see Alternative Performance Measures at this report. |
||||
| SOUTH AMERICA. DATA PER COUNTRY (MILLIONS OF EUROS) | |||||||||
|---|---|---|---|---|---|---|---|---|---|
| Country | Operating income | Net attributable profit (loss) | |||||||
| 1Q26 | 𝚫 % | 𝚫 % (1) | 1Q25 | 1Q26 | 𝚫 % | 𝚫 % (1) | 1Q25 | ||
| Argentina | 241 | 9.9 | n.s. | 220 | 27 | (45.9) | n.s. | 50 | |
| Colombia | 218 | 43.0 | 40.2 | 152 | 78 | 137.6 | 133.0 | 33 | |
| Peru | 330 | 7.6 | 9.6 | 306 | 81 | (2.6) | (0.8) | 83 | |
| Other countries (2) | 160 | 34.9 | 35.8 | 119 | 62 | 31.3 | 32.1 | 47 | |
| Total | 950 | 19.1 | 34.5 | 797 | 249 | 16.3 | 33.8 | 214 | |
| (1) At constant exchange rates. (2) Chile (Forum), Uruguay, Venezuela and Brazil. Additionally, it includes eliminations and other charges. |
|||||||||
| SOUTH AMERICA. RELEVANT BUSINESS INDICATORS PER COUNTRY (MILLIONS OF EUROS) | ||||||||
|---|---|---|---|---|---|---|---|---|
| Argentina | Colombia | Peru | ||||||
| 31-03-26 | 31-12-25 | 31-03-26 | 31-12-25 | 31-03-26 | 31-12-25 | |||
| Performing loans and advances to customers under management (1)(2) | 9,142 | 8,723 | 18,473 | 18,146 | 19,860 | 19,426 | ||
| Non-performing loans (1) | 622 | 458 | 808 | 831 | 870 | 896 | ||
| Customer deposits under management (1)(3) | 10,966 | 10,786 | 20,056 | 19,474 | 21,693 | 20,442 | ||
| Off-balance sheet funds (1)(4) | 2,853 | 2,229 | 3,311 | 3,123 | 3,289 | 3,141 | ||
| Risk-weighted assets | 12,115 | 10,501 | 20,112 | 19,171 | 20,202 | 19,856 | ||
| RORWA (5) | 1.5 | 1.8 | 1.7 | 0.8 | 3.5 | 3.1 | ||
| Efficiency ratio (%) | 49.3 | 51.5 | 39.9 | 46.3 | 38.7 | 38.9 | ||
| NPL ratio (%) | 6.3 | 4.9 | 4.1 | 4.3 | 3.6 | 3.7 | ||
| NPL coverage ratio (%) | 79 | 84 | 86 | 88 | 103 | 99 | ||
| Cost of risk (%) | 7.84 | 5.67 | 1.99 | 2.19 | 1.51 | 1.67 | ||
| (1) Figures at constant exchange rates. (2) Excluding repos. (3) Excluding repos and including specific marketable debt securities. (4) Includes mutual funds and customer portfolios (in Colombia and Peru preliminary data as of March 31, 2026). (5) For more information on the calculation methodology, as well as the calculation of the metric at the consolidated Group level, see Alternative Performance Measures at this report. |
||||||||
Unless expressly stated otherwise, all the comments below on rates of change, for both activity and results, will be given at constant exchange rates. These rates, together with the changes at current exchange rates, can be found in the attached tables of the financial statements and relevant business indicators.
Activity and results
The most relevant aspects related to the area's activity during the first quarter of the year 2026 have been:
Lending activity registered a positive variation of 2.6%, mainly supported by the dynamism of commercial loans (+2.9%), and consumer finance (+3.9%, as a whole).
With regard to the quality of the credit, the area's NPL ratio stood at 4.2%, which represents an increase of 12 basis points compared to the previous quarter, due to the performance of Argentina and Chile. For its part, the NPL coverage ratio for the area was 90%, representing a decrease of 206 basis points compared to the end of December, with a generalized declines across the board except Peru.
Customer funds under management increased at a rate of 5.5%, with growth of 4.6% in customer deposits and a variation of 11.3% in off-balance sheet funds.
South America generated a net attributable profit of €249 million in the first quarter of 2026, which represents a year-on-year growth of 16.3% at current exchange rates, favored mainly by the improvement in net attributable profit in Colombia.
Meanwhile, the impact of the adjustment for hyperinflation of subsidiaries domiciled in Argentina stands out, which implies, among other effects, the recording of the loss on the monetary position in the item "Other operating income and expenses" in the income statement. This impact amounted to €147 million in the period January - March 2026, above the €117 million recorded in the period January - March 2025.
More detailed information on the most representative countries of the business area is provided below.
Argentina
Macro and industry trends
The economic recovery has continued in the fourth quarter of 2025, led by the improvement in the primary sectors, raising GPD growth for the full year to 4.4%. For 2026, BBVA Research maintains its forecast of a gradual deceleration to rates of 3%, with investment and exports driving growth. Regarding the price environment, upside surprises in inflation during the first months of 2026 (in March it stood at 32.6%) raise the forecast for the overall rate at year-end to 29%, 15 points above the previous scenario.
The banking system is growing at a rapid pace, although the inflation control entails that the credit and deposit volume growth is more moderate than in previous quarters. With data at the end of March 2026, total lending increased by 56.8% compared to March 2025, favored by consumer, corporate and, above all, mortgage portfolios, which grew by 45%, 59% and 172% year-on-year, respectively. For their part, deposits have increased and at the end of March recorded a year-on-year growth of 64%. Finally, the NPL ratio has rebounded due to the growth in household credit defaults, standing at 6.4% at the end of January 2026.
Activity and results
In the first quarter of 2026, performing loans under management grew by 4.8%, below the quarterly inflation rate (+8,7%). At the end of March 2026, the NPL ratio stood at 6.3%, an increase of 136 basis points compared to the end of December 2025, mainly due to retail portfolio NPL entries affecting the NPL coverage ratio, which stood at 79%, below the level recorded at the end of December 2025.
Customer funds grew by 6.2%, with mutual funds showing a notable growth of 28.0%.
Regarding the evolution of the income statement19, the cumulative net attributable profit at the end of March 2026 stood at €27 million, with growth in recurring revenue offset by lower NTI and a greater impact for hyperinflation compared to the end of March 2025. An 89.3% increase was observed in provisions for impairment in financial assets due to higher requirements in the retail portfolio, partly affected by a larger portfolio volume. Meanwhile, the quarterly cost of risk stood at 7.84%, which represents a decrease of 4 basis points compared to the cost of risk in the last quarter of the previous year.
Colombia
Macro and industry trends
Household consumption and public spending have continued to support economic activity the last months of 2025, with GDP growth standing at 2.6% for that year. BBVA Research maintains its growth forecast for 2026 at 2.8% supported by domestic demand and with a better performance of activity during the first half of the year. The increase in the minimum wage largely explains the persistence of inflationary pressures and the restrictive tone of monetary policy. Headline inflation could close 2026 at 6.5%, compared to 5.6% in March, and interest rates at 12.25% (11.25% in March).
Total credit growth in the banking system stood at 9.1% year-on-year in February 2026, with growth across all portfolios. Thus, corporate lending, mortgage lending, and consumer lending portfolios showed year-on-year growth rates of 8.5%, 11.8% and 8.5%, respectively in February 2026. On the other hand, total deposits grew by 12,9% year-on-year at the end of February 2026, with a performance marked by the growth in demand deposits. Thus, demand and time deposits grew by 16.1% and 8.9% year-on-year respectively. The system's NPL ratio has improved in the last few months, standing at 3.87% in February 2026, 83 basis points below the figure for the same month of the previous year.
Activity and results
Lending activity grew at a rate of 1.8% compared to the end of 2025, favored by the performance of the corporate banking segment. In terms of asset quality indicators, with respect to the end of 2025: the NPL ratio stood at 4.1%, representing a decrease of 21 basis points with respect to the previous quarter, continuing the positive trend of recent quarters. On the other hand, coverage stood at 86%, with a decrease of 266 basis points compared to the previous quarter.
Customer funds grew by 3.4% compared to the end of 2025, with a 3.6% increase in time deposits, 2.4% in the case of demand deposits and 6.0% in the case of off-balance sheet funds.
The cumulative net attributable profit at the end of March 2026 stood at €78 million, that is, 137.6% higher than at the result at the end of the same period of the previous year (at current exchange rates), driven by the growth in recurring income and lower loan-loss provisions due to reduced requirements in the retail portfolio. For its part, the cumulative cost of risk stood at 1.99% at the end of March 2026, down 10 basis points in the quarter.
Perú
Macro and industry trends
Economic activity continued to show a relatively good performance in the last quarter of 2025, supported by private consumption and investment, placing GDP growth for the full year at 3.4%. For 2026, BBVA Research forecasts a deceleration in growth to rates 2.9%, two tenths below what was expected in the previous scenario. Even though domestic demand remains dynamic and gold and copper prices are favorable, the recent deterioration in weather conditions, the restriction in the local fuel supply, and internal political uncertainty will limit GDP growth. For its part, inflation is expected to moderate gradually throughout the year, after the rebound in March, when it reached 3.8% to close the year at levels of 2.6%. The moderation in growth and price could control anticipate stability in interest rates at the current level of 4.25%.
Total lending in the Peruvian banking system increased by 4.4% year-on-year in February 2026, with positive growth in all portfolios. Thus, the consumer credit portfolio grew by 10.3% year-on-year, the mortgage portfolio increased by 6.9% and the corporate loan portfolio by 1.6% year-on-year. For its part, the system's total deposits registered a year-on-year growth of 8.0% in February 2026, thanks to the 12.7% growth in demand deposits and recovery in time deposits to -1.1% year-on-year. Finally, the system's NPL ratio continued on a downward trend, reaching a rate of 3.11% in February 2026.
Activity and results
Lending activity grew by 2.2% compared to the end of December 2025, with business loans increasing by 1.9%, followed by consumer finance at 4.4%. Regarding the asset quality indicators, the NPL ratio decreased compared to the end of December 2026 (-19 basis points) placing at 3.6%, reflecting continued strong recovery performance and contained entries. Meanwhile, the NPL coverage ratio was 103%, which represents an increase of 359 basis points compared to the end of December, supported by the reduction in non-performing loans. For its part, the cost of risk at the end of March 2026 stood at 1.51%, an increase of 10 basis points compared to the cost of risk at the end of the last quarter of 2025.
Customers funds under management increased during the first quarter of 2026 (+5.9%), mainly due to the favorable performance in customer base deposits (+6.1%).
BBVA Peru's cumulative attributable profit stood at the end of March 2026 at €81 million, that is, in line with the results achieved in the first quarter of the precious year (€83 million). During the period, a growth in net interest income was observed, associated with a higher profitability of the loan portfolio, as well as higher fees and results from the Global Markets unit included in NTI. Operating expenses increased due to higher general expenses, particularly in advertising and technology, as well as higher personnel costs due to the expansion of the workforce. Meanwhile, an increase in the level of impairments and higher charges to provisions for contingent commitments were observed, which compare with the releases of the previous year.
20 At current rates, that is, the impact of exchange rate fluctuations on the profit and loss account is not excluded.
Read legal disclaimer of this report.