
Mexico
Highlights for the period January - March 2026
- Growth in lending, driven by the momentum of the wholesale segment
- Good performance of all components of gross income
- Favorable evolution in the insurance business
- Quarterly net attributable profit stands at high levels and above the previous quarter
BUSINESS ACTIVITY (1)
(VARIATION AT CONSTANT EXCHANGE RATE COMPARED TO 31-12-25)
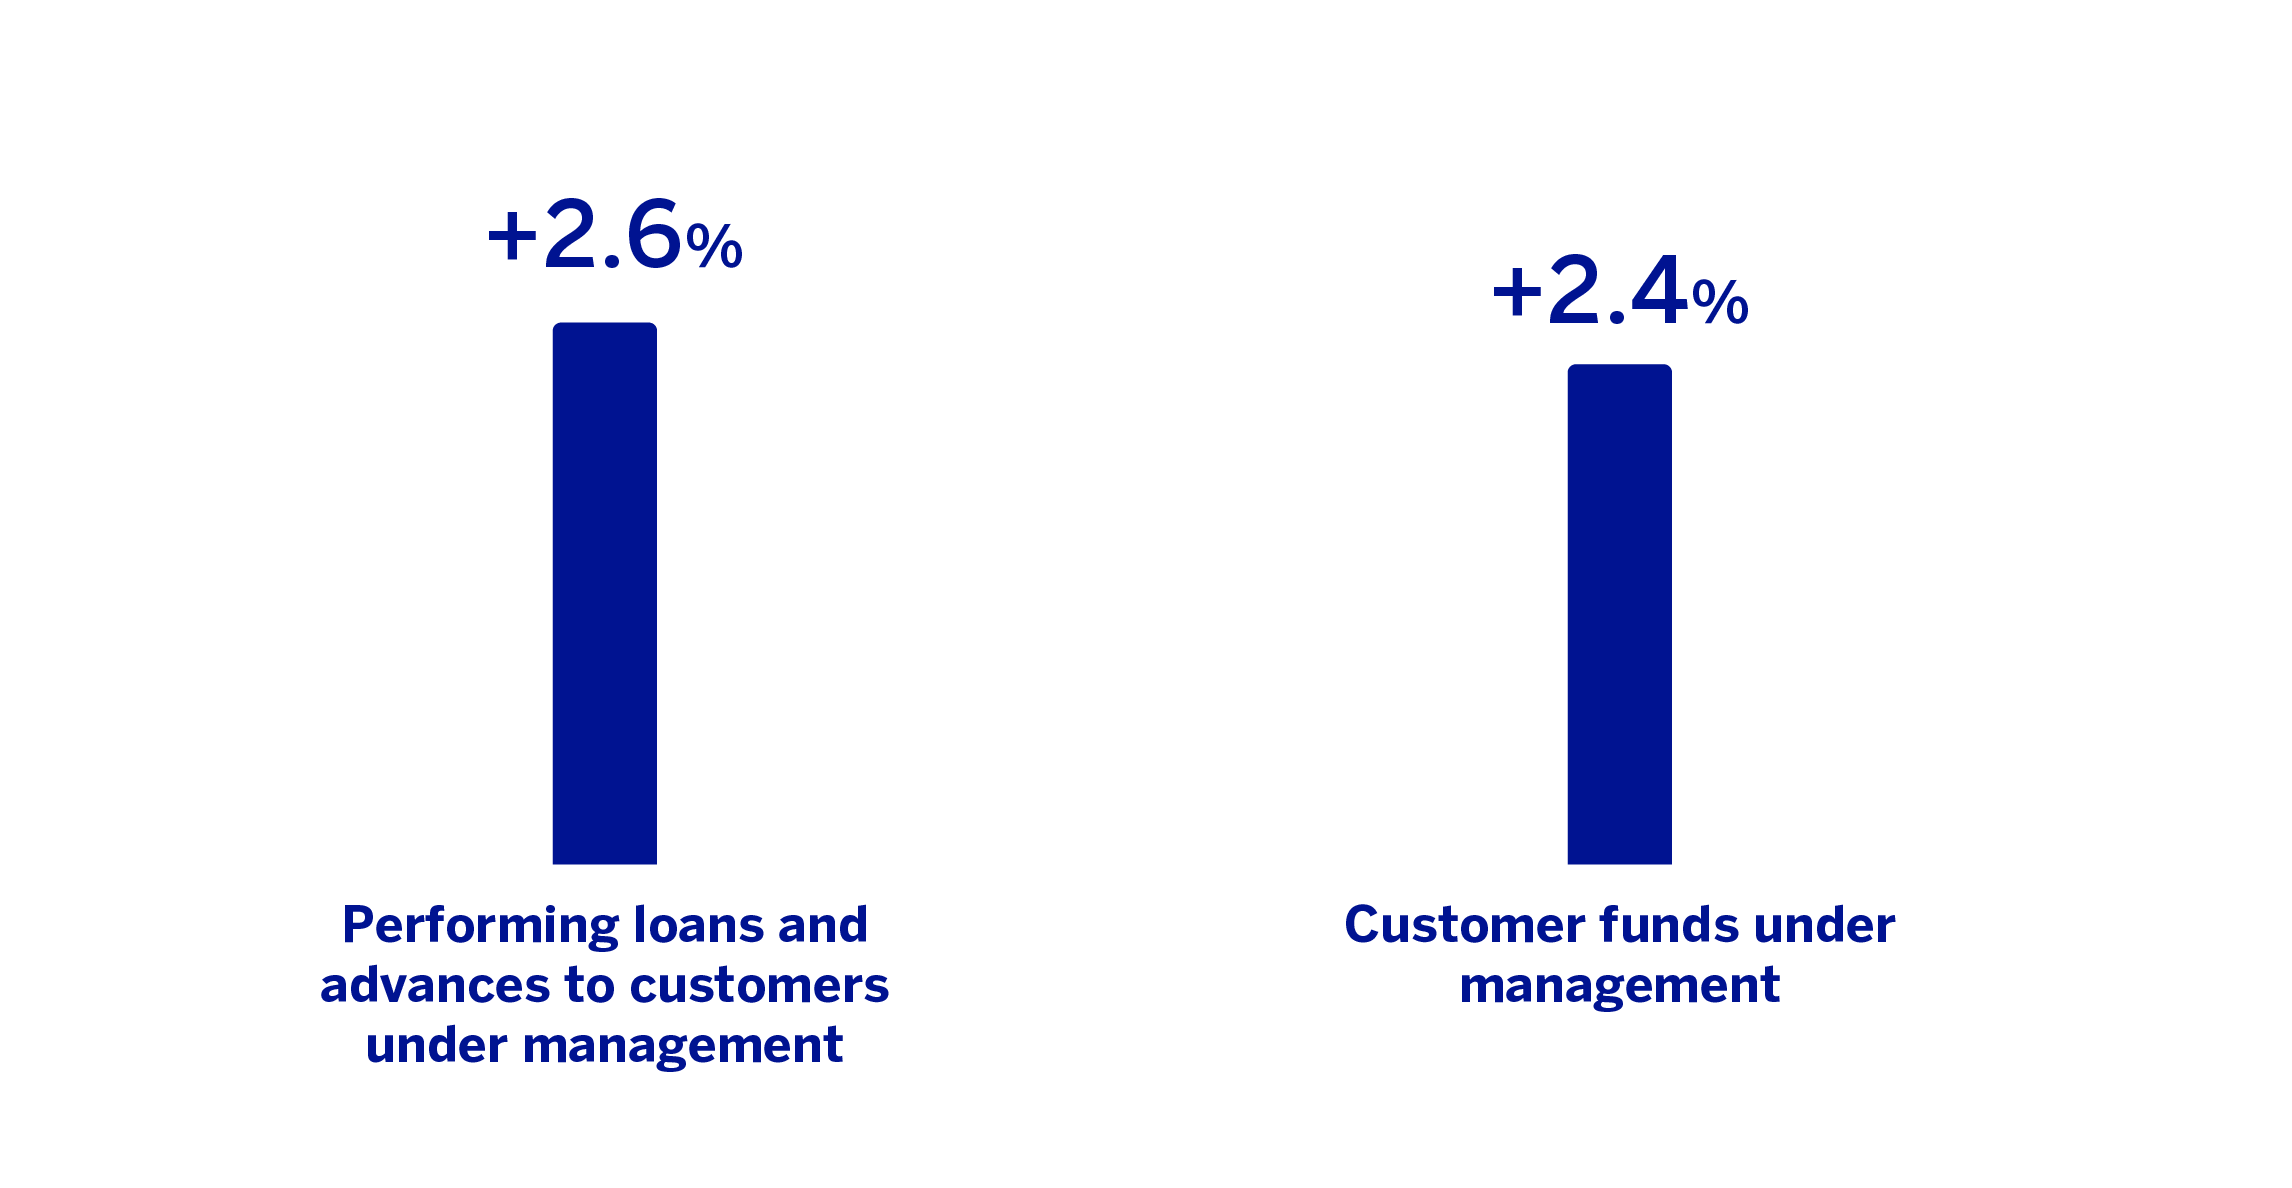
(1) Excluding repos.
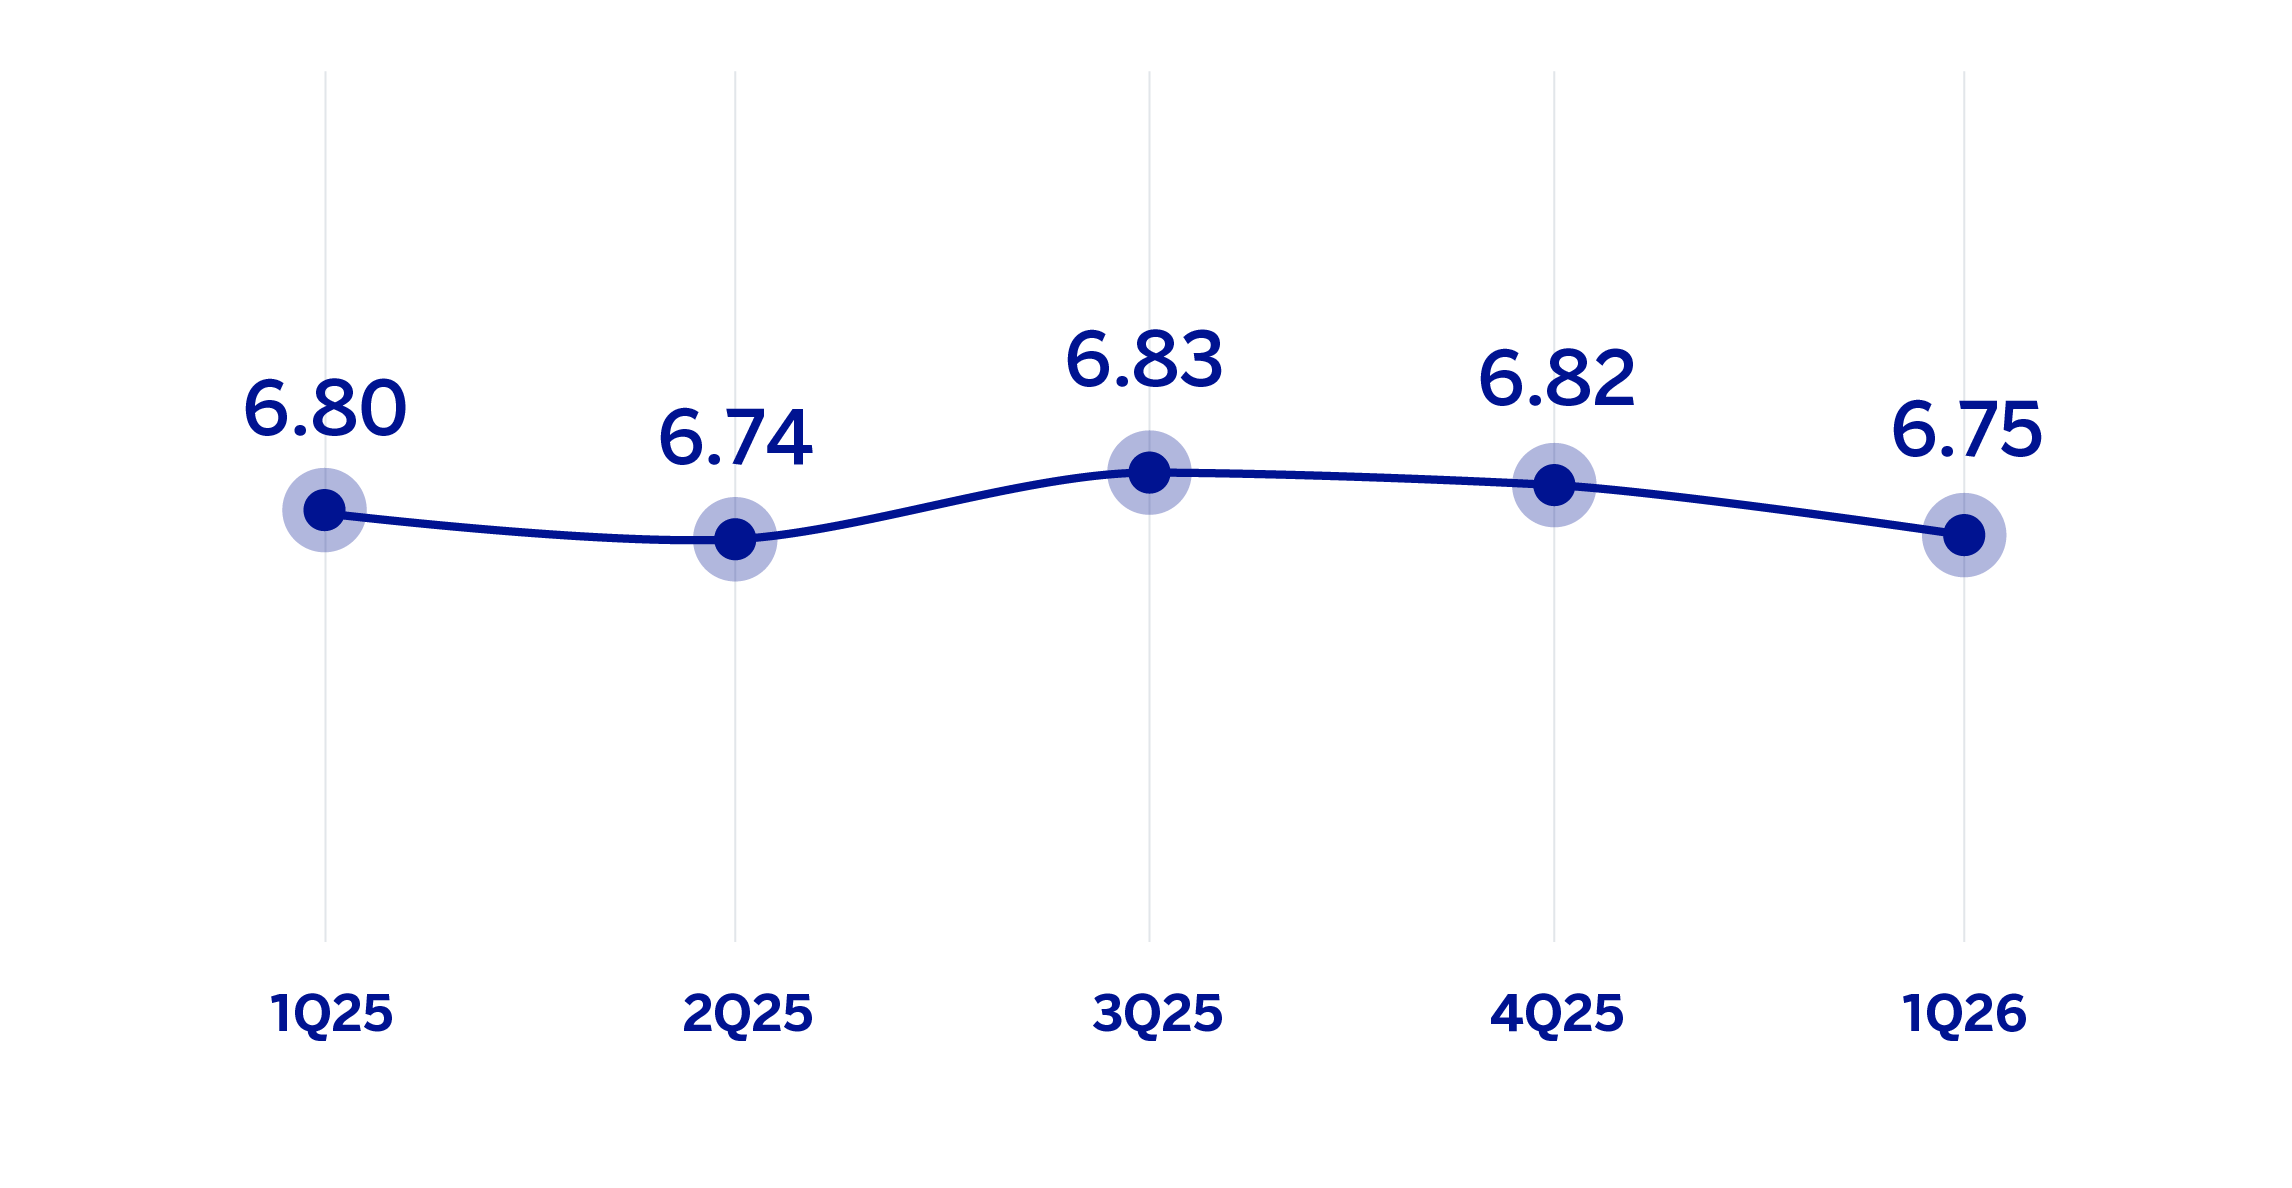
NET INTEREST INCOME / AVERAGE TOTAL ASSETS
(PERCENTAGE AT CONSTANT EXCHANGE RATE)
OPERATING INCOME
(MILLIONS OF EUROS AT CONSTANT EXCHANGE RATE)
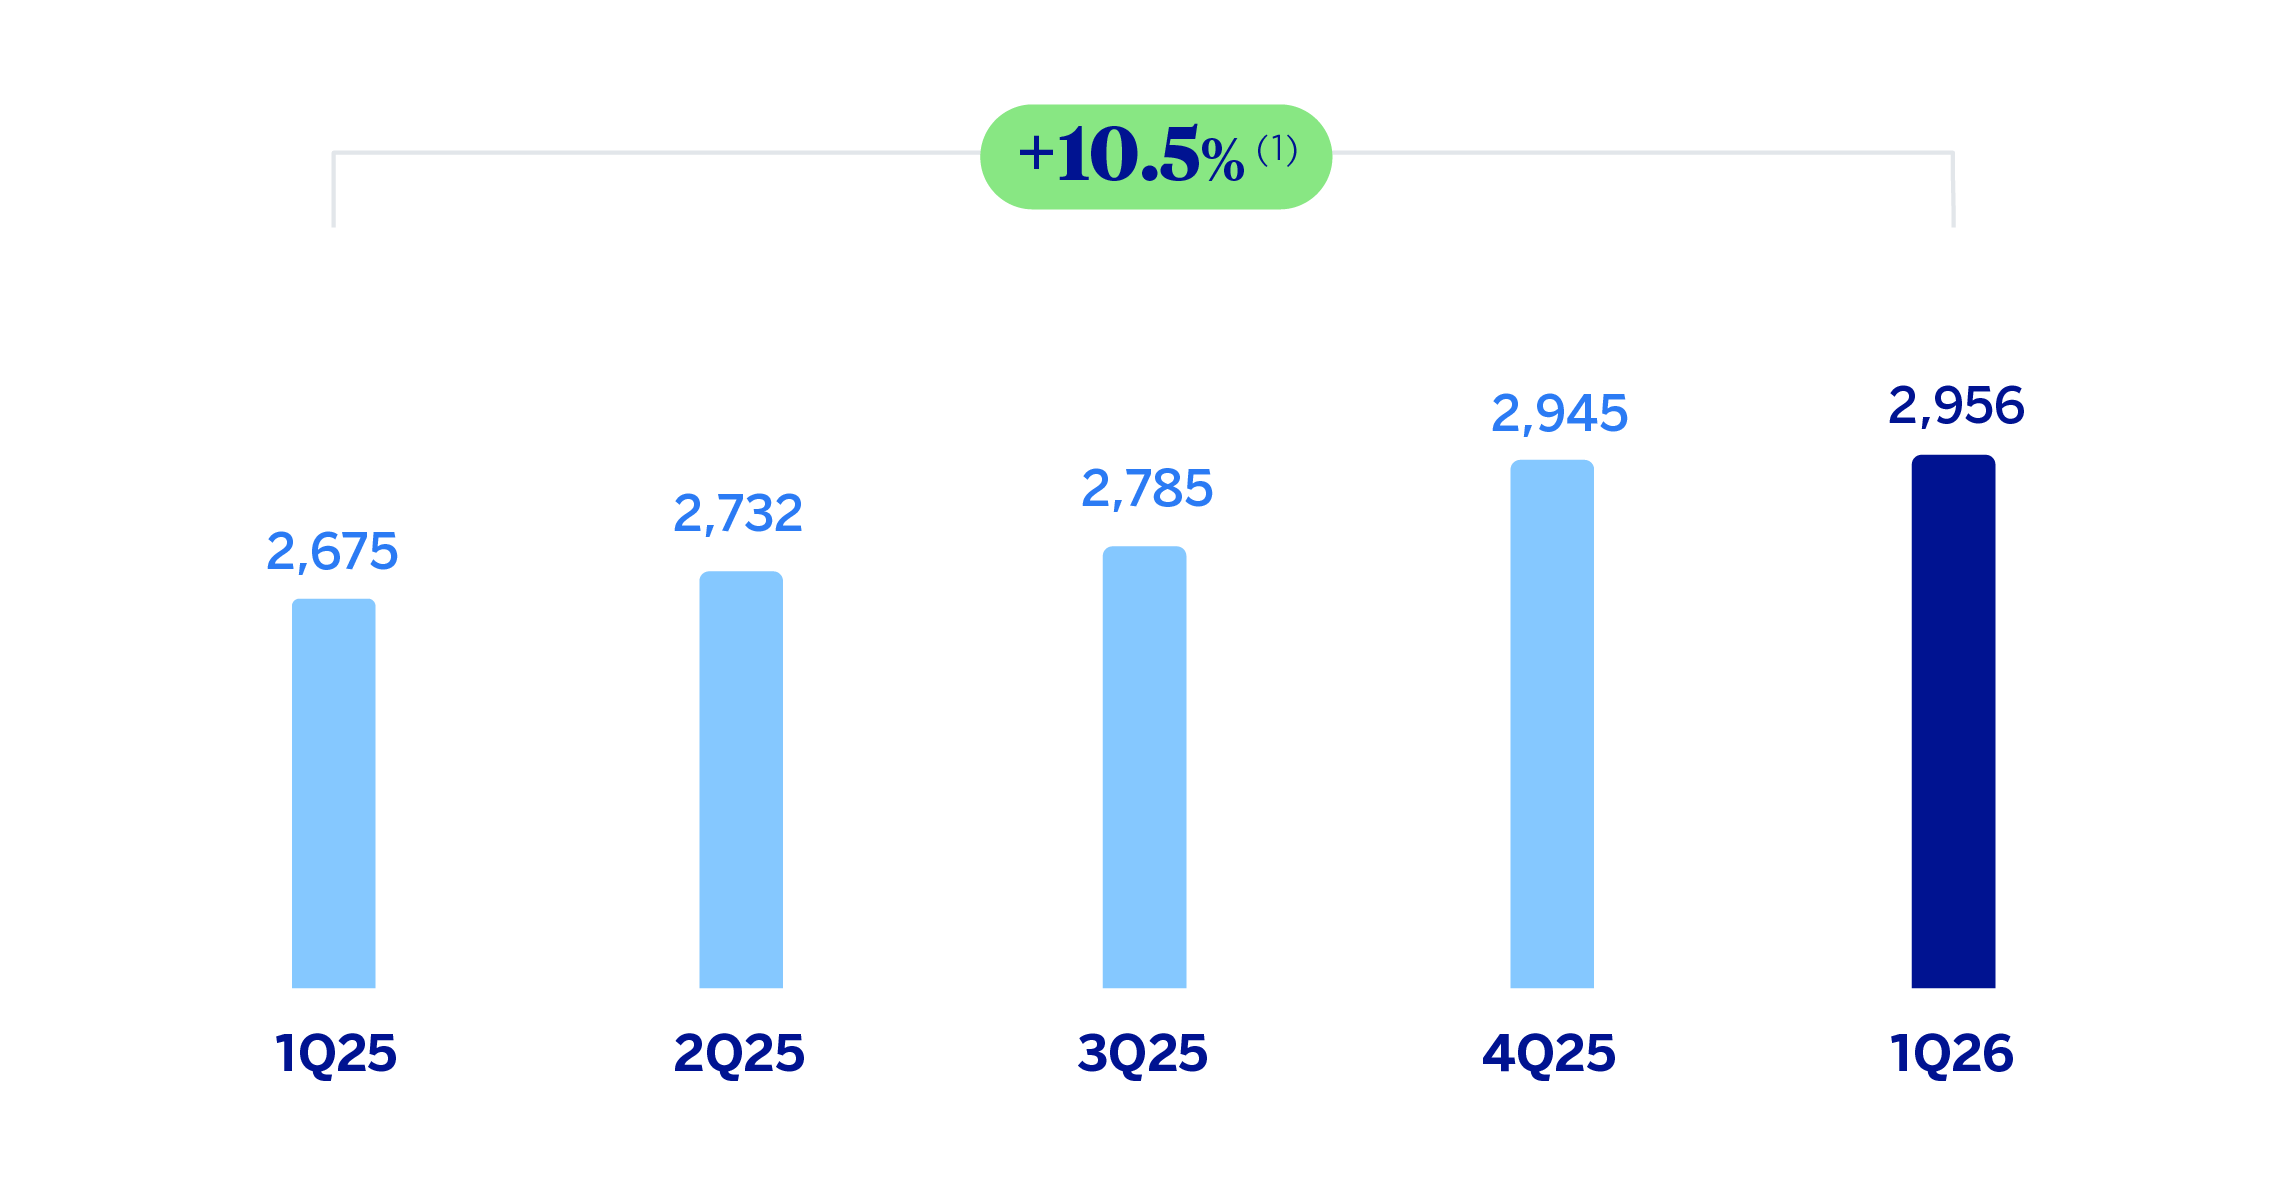
(1) At current exchange rate: 15.6%.
NET ATTRIBUTABLE PROFIT (LOSS)
(MILLIONS OF EUROS AT CONSTANT EXCHANGE RATE)
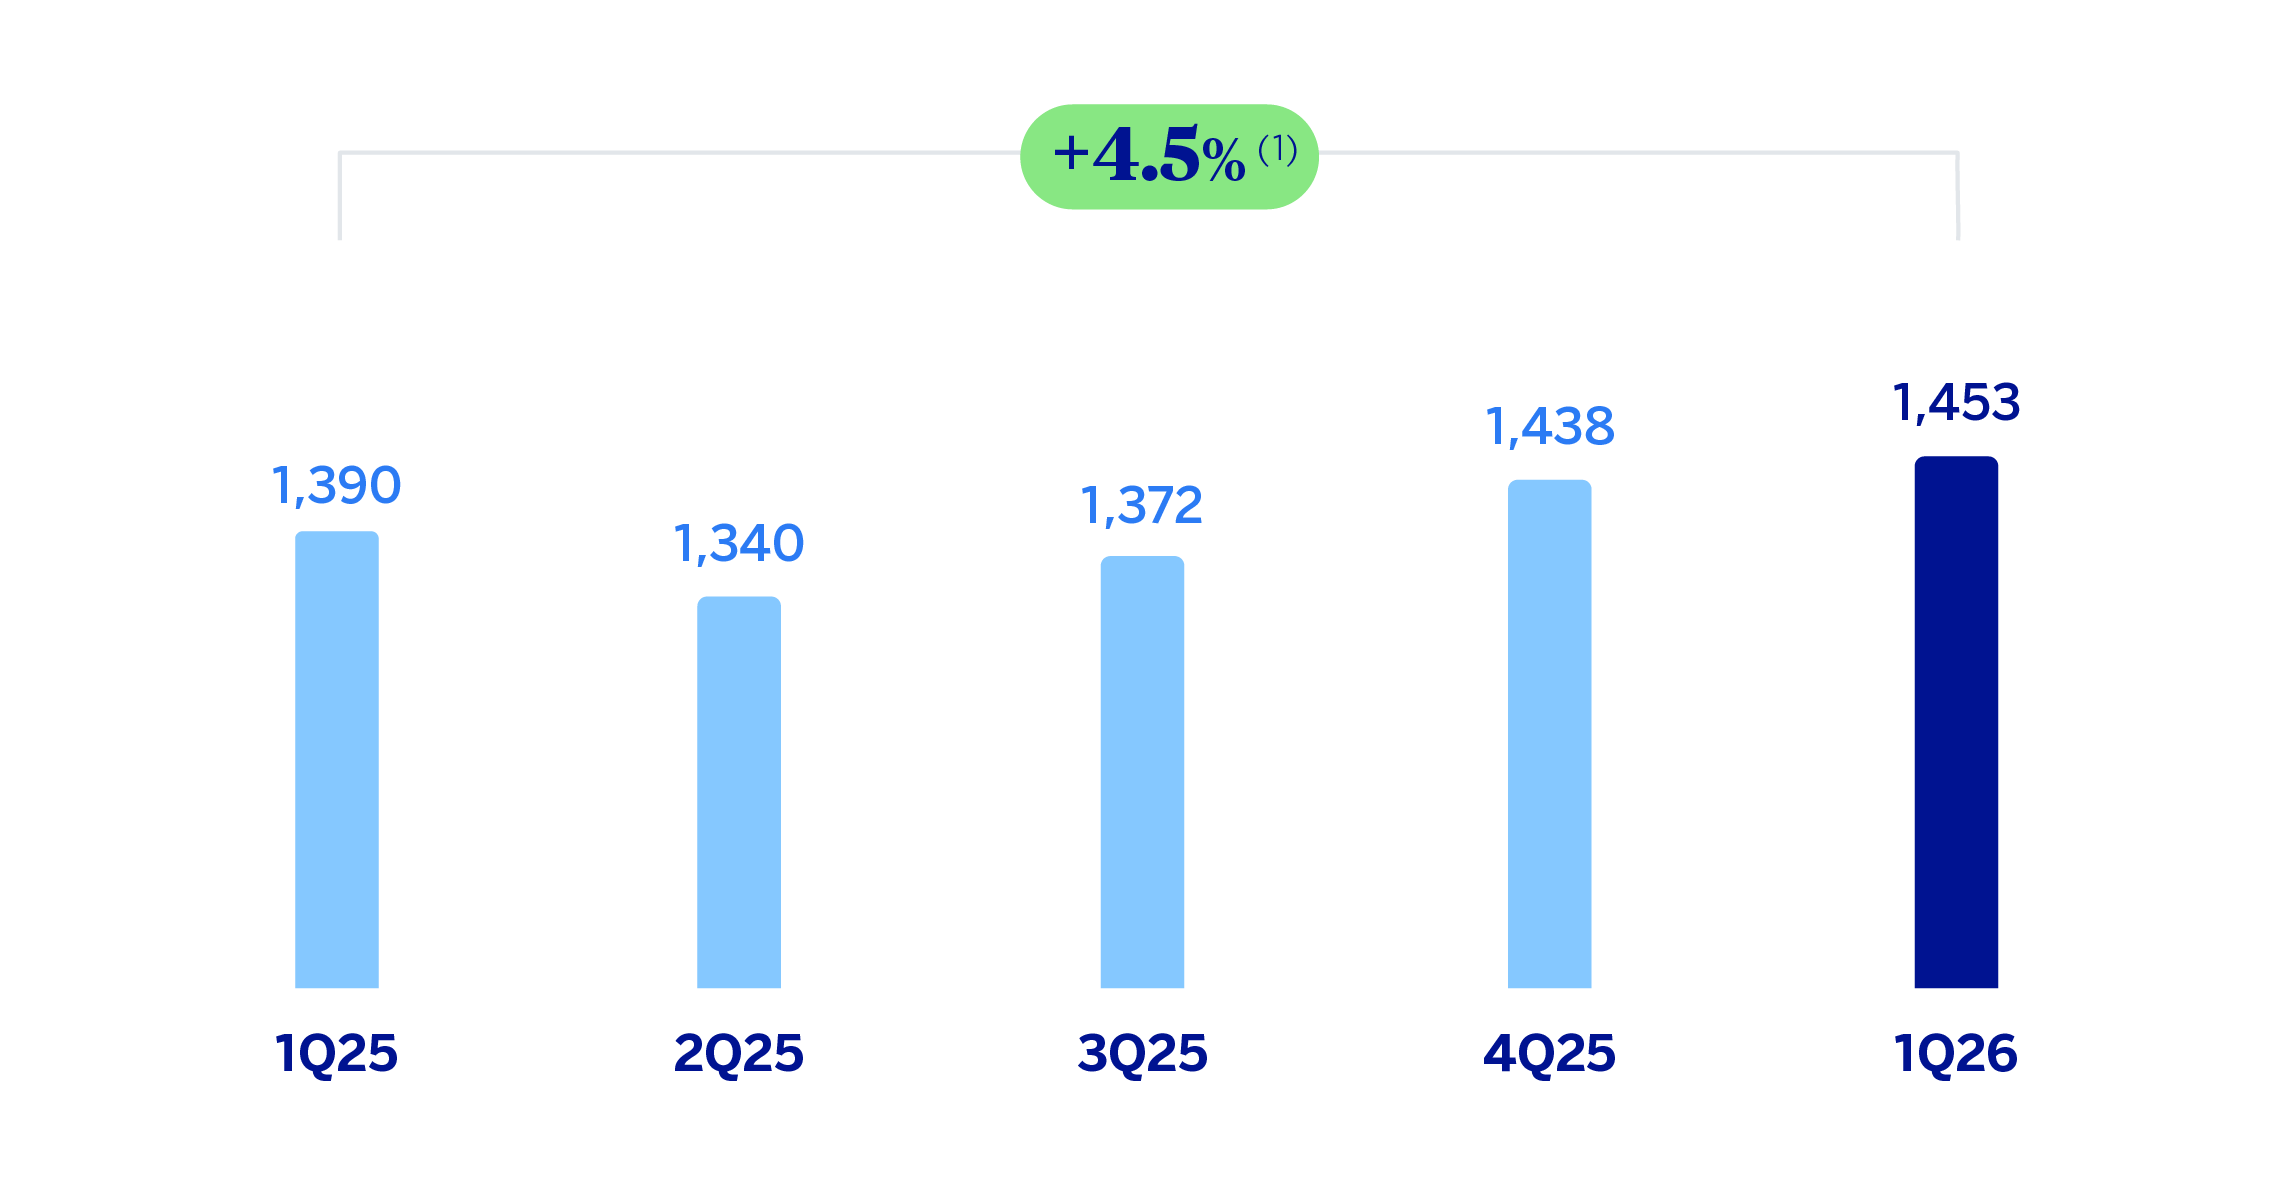
(1) At current exchange rate: 9.3%.
| FINANCIAL STATEMENTS AND RELEVANT BUSINESS INDICATORS (MILLIONS OF EUROS AND PERCENTAGE) | ||||
|---|---|---|---|---|
| Income statement | 1Q26 | 𝚫 % | 𝚫 % (1) | 1Q25 (2) |
| Net interest income | 3,136 | 13.3 | 8.3 | 2,767 |
| Net fees and commissions | 648 | 11.2 | 6.3 | 583 |
| Net trading income | 286 | 29.8 | 24.0 | 220 |
| Other operating income and expenses | 204 | 51.0 | 44.6 | 135 |
| Gross income | 4,274 | 15.4 | 10.3 | 3,705 |
| Operating expenses | (1,318) | 14.8 | 9.8 | (1,148) |
| Personnel expenses | (607) | 9.9 | 5.1 | (553) |
| Other administrative expenses | (588) | 20.7 | 15.3 | (487) |
| Depreciation | (123) | 13.7 | 8.6 | (108) |
| Operating income | 2,956 | 15.6 | 10.5 | 2,557 |
| Impairment on financial assets not measured at fair value through profit or loss | (883) | 27.0 | 21.4 | (696) |
| Provisions or reversal of provisions and other results | (9) | (36.4) | (39.3) | (14) |
| Profit (loss) before tax | 2,064 | 11.7 | 6.8 | 1,847 |
| Income tax | (611) | 17.8 | 12.6 | (518) |
| Profit (loss) for the period | 1,453 | 9.3 | 4.5 | 1,329 |
| Non-controlling interests | (0) | 8.6 | 3.8 | (0) |
| Net attributable profit (loss) | 1,453 | 9.3 | 4.5 | 1,329 |
| Balance sheets | 31-03-26 | 𝚫 % | 𝚫 % (1) | 31-12-25 (2) |
| Cash, cash balances at central banks and other demand deposits | 9,434 | (9.4) | (11.2) | 10,417 |
| Financial assets designated at fair value | 59,481 | (1.1) | (3.0) | 60,136 |
| Of which: Loans and advances | 5,691 | (12.7) | (14.4) | 6,523 |
| Financial assets at amortized cost | 109,712 | 4.0 | 2.0 | 105,494 |
| Of which: Loans and advances to customers | 101,835 | 4.7 | 2.7 | 97,259 |
| Tangible assets | 2,097 | 0.8 | (1.2) | 2,081 |
| Other assets | 5,024 | 11.0 | 8.9 | 4,525 |
| Total assets/liabilities and equity | 185,748 | 1.7 | (0.3) | 182,654 |
| Financial liabilities held for trading and designated at fair value through profit or loss | 30,966 | (5.0) | (6.8) | 32,584 |
| Deposits from central banks and credit institutions | 6,058 | 0.5 | (1.5) | 6,028 |
| Deposits from customers | 99,308 | 5.8 | 3.8 | 93,855 |
| Debt certificates | 12,506 | 7.2 | 5.1 | 11,664 |
| Other liabilities | 25,327 | (7.9) | (9.7) | 27,507 |
| Allocated regulatory capital | 11,584 | 5.2 | 3.1 | 11,015 |
| Relevant business indicators | 31-03-26 | 𝚫 % | 𝚫 % (1) | 31-12-25 |
| Performing loans and advances to customers under management (3) | 102,274 | 4.6 | 2.6 | 97,744 |
| Non-performing loans | 2,788 | (1.0) | (2.9) | 2,817 |
| Customer deposits under management (3) | 98,391 | 4.9 | 2.8 | 93,817 |
| Off-balance sheet funds (4) | 72,169 | 3.8 | 1.8 | 69,533 |
| Risk-weighted assets | 83,745 | 1.2 | (0.7) | 82,746 |
| RORWA (1)(5) | 7.0 | 6.0 | ||
| Efficiency ratio (%) | 30.8 | 30.5 | ||
| NPL ratio (%) | 2.6 | 2.7 | ||
| NPL coverage ratio (%) | 129 | 124 | ||
| Cost of risk (%) | 3.45 | 3.31 | ||
| (1) At constant exchange rate. (2) Revised balances. For more information, please refer to the “Business Areas” section. (3) Excluding repos. (4) Includes mutual funds, customer portfolios and other off-balance sheet funds. (5) For more information on the calculation methodology, as well as the calculation of the metric at the consolidated Group level, see Alternative Performance Measures at this report. |
||||
Macro and industry trends
The Mexican economy has shown a better-than-expected performance in the last quarter of 2025, thanks to the support of private consumption and the services sector. The forecasted recovery for investment and the manufacturing sector, in a context of lower-than-anticipated trade tariffs, a more contained fiscal adjustment, and a certain dynamism in exports linked to the technology sector, should contribute to boosting growth in the coming quarters. All in all, BBVA Research places the expected GDP growth for 2026 at 1.8%, six tenths above what was anticipated in the previous scenario and one percentage point higher than the observed in 2025 (0.8%). For its part, the headline inflation has increased slightly in the first two months of 2026, standing at 4.6% in March and potentially closing the year at 3.9%. The interest rate forecast remains unchanged: the expected price and activity environment anticipates an additional cut, establishing 6.5% as the target level for 2026.
Regarding the banking system, with data at the end of February 2026, the volume of credit to the non-financial private sector loans by 5.5% year-on-year in nominal terms. Generalized growth is observed in all the main portfolios: 11.5% for consumer credit, 5.0%, for mortgage loans, and 2.8% for business loans. The growth of total deposits (demand and time deposits) is slightly higher than the credit growth (+6.2% year-on-year in February 2026), with greater dynamism in time deposits (+7.8%) than in demand deposits (+5.3%). For its part, the NPL ratio stood at 2.46% in February 2026, and capital indicators remained comfortable.
Unless expressly stated otherwise, all the comments below on rates of variation, for both activity and results, will be given at constant exchange rate. These rates, together with variations at current exchange rates, can be found in the attached tables of financial statements and relevant business indicators.
Activity
The most relevant aspects related to the area's activity in the first quarter of 2026 were:
During the quarter, lending activity grew by 2.6%, with more notable growth in the wholesale portfolio (+3.6%), driven by the dynamism of business lending. Meanwhile, the retail portfolio grew at a slower pace, 1.7%, showing some deceleration compared to the previous quarter, which had been boosted by year-end sales campaigns promoting consumer credit and credit cards.
With regard to the asset quality indicators, the NPL ratio stood at 2.6% as of the end of March 2026, which represents a decrease of 15 basis points compared to the end of December. This improvement was mainly explained by the stronger business activity and the reduction in non-performing balances due to lower entries in both retail and wholesale, positively impacting the NPL coverage ratio, which stood at 129% as of the end of March 2026, which represents an increase of 5 percentage points compared to the end of December.
Customer deposits under management were 2.4% above the December balances, originated from the evolution of customer deposits (+2.8%). For its part, off-balance sheet funds grew by 1.8%.
Results
BBVA Mexico achieved a net attributable profit of €1,453 million at the end of March 2026, which represents a year-on-year growth of 4.5%, explained mainly by the favorable evolution of net interest income and supported by the evolution of fees, NTI and the insurance business.
The most relevant aspects of the year-on-year evolution in the income statement as of the end of March 2026 are summarized below:
Net interest income increased by 8.3%, mainly driven by higher lending volumes and favored by lower funding costs.
Net fees and commissions grew by 6.3%, mainly as a result of the higher revenues from asset management, and those associated with wholesale operations (administration and advisory).
The contribution from NTI increased by 24.0% fundamentally due to higher results from Global Markets.
The other operating income and expenses line item recorded an increase of 44.6%, favored by the strong performance of the insurance business.
Operating expenses grew by 9.8%, mainly due to the increase in overhead costs (technology expenses and advertising expenses) and, to a lesser extent, higher personnel expenses.
Loan-loss provisions increased by 21.4%, with higher portfolio requirements supported by growth and a greater weight in retail portfolios. Thus, the cumulative cost of risk at the end of March 2026 increased to 3.45%, stable compared to the previous quarter.
Read legal disclaimer of this report.