Click on each area to learn more
Spain
Spain
HIGHLIGHTS
|
RESULTS
| |
| Net interest income | Gross income |
| 1,607 | 2,533 |
| +1.2% (2) | +18.2% (2) |
| Operating income | Net atributable profit |
| 1,717 | 1,024 |
| +29.5% (2) | +43.8% (2) |
ACTIVITY (1)
|
|
| Variation compared 31-12-24. Balances as of 31-03-25. |
|
| Performing loans and advances to customers under management | Customer funds under management |
| +2.9% | -0.3% |
RISKS |
| NPL coverage ratio |
| 59% | 61% |
| NPL ratio |
| 3.7% | 3.5% |
| Cost of risk |
| 0.38% | 0.30% |
(2) Year-on-year changes.
Mexico
Mexico
HIGHLIGHTS
|
RESULTS
| |
| Net interest income | Gross income |
| 2,767 | 3,705 |
| +7.6% (2) | +8.9% (2) |
| Operating income | Net atributable profit |
| 2,561 | 1,332 |
| +7.7% (2) | +7.8% (2) |
ACTIVITY (1)
|
|
| Variation compared 31-12-24. Balances as of 31-03-25. |
|
| Performing loans and advances to customers under management | Customer funds under management |
| +2.0% | +4.7% |
RISKS |
| NPL coverage ratio |
| 121% | 129% |
| NPL ratio |
| 2.7% | 2.4% |
| Cost of risk |
| 3.39% | 3.05% |
(2) Year-on-year changes.
Turkey
Turkey
HIGHLIGHTS
|
RESULTS
| |
| Net interest income | Gross income |
| 701 | 1,267 |
| +193.2% (2) | +85.2% (2) |
| Operating income | Net atributable profit |
| 690 | 158 |
| +130.5% (2) | +219.9% (2) |
ACTIVITY (1)
|
|
| Variation compared 31-12-24. Balances as of 31-03-25. |
|
| Performing loans and advances to customers under management | Customer funds under management |
| +10.5% | +19.6% |
RISKS |
| NPL coverage ratio |
| 96% | 93% |
| NPL ratio |
| 3.1% | 3.2% |
| Cost of risk |
| 1.27% | 1.89% |
(2) Year-on-year changes.
South America
South America
HIGHLIGHTS
|
RESULTS
| |
| Net interest income | Gross income |
| 1,231 | 1,438 |
| -12.4% (2) | +39.0% (2) |
| Operating income | Net atributable profit |
| 803 | 218 |
| +71.6% (2) | +236.2% (2) |
ACTIVITY (1)
|
|
| Variation compared 31-12-24. Balances as of 31-03-25. |
|
| Performing loans and advances to customers under management | Customer funds under management |
| +2.8% | +2.1% |
RISKS |
| NPL coverage ratio |
| 88% | 90% |
| NPL ratio |
| 4.5% | 4.3% |
| Cost of risk |
| 2.87% | 2.30% |
(2) Year-on-year changes.
Rest of business
Rest of business
HIGHLIGHTS
|
RESULTS
| |
| Net interest income | Gross income |
| 191 | 437 |
| +21.7% (2) | +28.3% (2) |
| Operating income | Net atributable profit |
| 236 | 173 |
| +31.5% (2) | +41.8% (2) |
ACTIVITY (1)
|
|
| Variation compared 31-12-24. Balances as of 31-03-25. |
|
| Performing loans and advances to customers under management | Customer funds under management |
| +1.0% | +3.5% |
RISKS |
| NPL coverage ratio |
| 102% | 109% |
| NPL ratio |
| 0.3% | 0.3% |
| Cost of risk |
| 0.17% | 0.16% |
(2) Year-on-year changes.
* Gross income.
(1) At constant exchange rate.
(2) At constant exchange rates.
This section presents the most relevant aspects of the Group's different business areas. Specifically, for each one of them, it shows a summary of the income statements and balance sheets, the business activity figures and the most significant ratios.
The structure of the business areas reported by the BBVA Group on March 31, 2025 is the same as the one presented at the end of 2024.
The composition of BBVA Group's business areas is summarized below:
- Spain mainly includes the banking, insurance and asset management activities that the Group carries out in this country.
- Mexico includes banking, insurance and asset management activities in this country, as well as the activity that BBVA Mexico carries out through its Houston agency.
- Turkey reports the activity of the group Garanti BBVA that is mainly carried out in this country and, to a lesser extent, in Romania and the Netherlands.
- South America includes banking, financial, insurance and asset management activities conducted, mainly, in Argentina, Chile, Colombia, Peru, Uruguay and Venezuela.
- Rest of Business mainly incorporates the wholesale activity carried out in Europe (excluding Spain), the United States, and BBVA’s branches in Asia.
The Corporate Center contains the centralized functions of the Group, including: the costs of the head offices with a corporate function for the consolidated BBVA Group; structural exchange rate positions management; certain portfolios, such as financial and industrial holdings; stakes in Funds & Investment Vehicles in tech companies; certain tax assets and liabilities; funds due to commitments to employees; goodwill and other intangible assets as well as portfolios and assets' funding. Finally, in the description of this aggregate, it is worth mentioning that the Corporate Center's tax expense includes for each interim period the difference between the effective tax rate in the period of each business area and the expected tax rate of the Group for the year as a whole.
In addition to these geographical breakdowns, supplementary pro forma information is provided for the wholesale business, Corporate & Investment Banking (CIB), carried out by BBVA in the countries where it operates. This business is relevant to have a broader understanding of the Group's activity and results due to the important features of the type of customers served, products offered and risks assumed, even if this is a pro forma information that does not capture the application of the hyperinflation accounting nor the wholesale business of the Group in Venezuela.
To prepare the information by business areas, which is presented under management criteria based on the financial information used in the preparation of the financial statements, in general, the lowest level units and/or companies that make up the Group are taken and assigned to the different areas according to the main region or company group in which they carry out their activity. In relation to the information related to the business areas, in the first quarter of 2025 the Group has carried out the reassignment of certain activities, which has affected Spain, Rest of Business and the Corporate Center, as well as CIB's pro forma supplementary information. So, in order to make those year-on-year comparisons homogeneous, the figures for year 2024 have been revised, which has not affected the consolidated financial information of the Group.
Regarding the shareholders' funds allocation in the business areas, a capital allocation system based on the consumed regulatory capital is used.
Finally, it should be noted that, as usual, in the case of the different business areas of Mexico, Turkey, South America and Rest of Business, and, additionally, CIB, in addition to the year-on-year variations applying current exchange rates, the variations at constant exchange rates are also disclosed.
GROSS INCOME (1), OPERATING INCOME (1) AND NET ATTRIBUTABLE PROFIT (1) BREAKDOWN (PERCENTAGE. 1Q25)
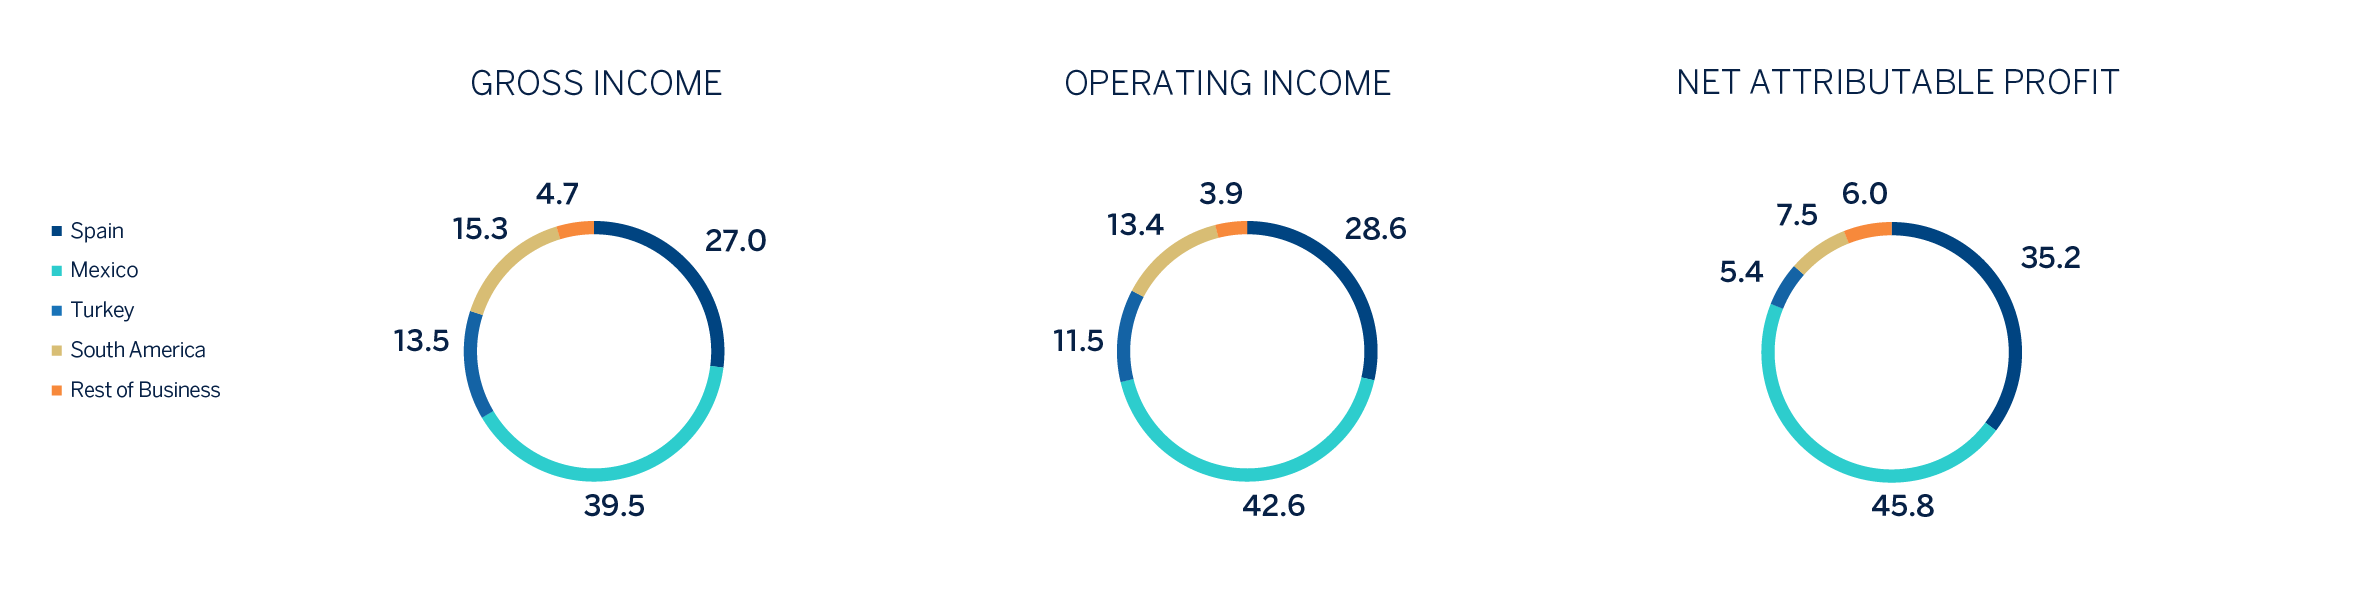
(1) Excludes the Corporate Center.
| MAIN INCOME STATEMENT LINE ITEMS BY BUSINESS AREA (MILLIONS OF EUROS) | ||||||||
|---|---|---|---|---|---|---|---|---|
| BBVA Group | ∑ Business areas | Corporate Center |
||||||
| Spain | Mexico | Turkey | South America | Rest of Business |
||||
| 1Q25 | ||||||||
| Net interest income | 6,398 | 1,607 | 2,767 | 701 | 1,231 | 191 | 6,497 | (99) |
| Gross income | 9,324 | 2,533 | 3,705 | 1,267 | 1,438 | 437 | 9,380 | (55) |
| Operating income | 5,762 | 1,717 | 2,561 | 690 | 803 | 236 | 6,007 | (245) |
| Profit (loss) before tax | 4,348 | 1,553 | 1,852 | 453 | 512 | 220 | 4,590 | (242) |
| Net attributable profit (loss) | 2,698 | 1,024 | 1,332 | 158 | 218 | 173 | 2,906 | (208) |
| 1Q24 (1) | ||||||||
| Net interest income | 6,512 | 1,587 | 2,999 | 277 | 1,555 | 157 | 6,575 | (64) |
| Gross income | 8,218 | 2,143 | 3,967 | 897 | 1,201 | 339 | 8,547 | (329) |
| Operating income | 4,835 | 1,325 | 2,773 | 453 | 600 | 180 | 5,331 | (496) |
| Profit (loss) before tax | 3,458 | 1,130 | 2,009 | 413 | 201 | 163 | 3,916 | (459) |
| Net attributable profit (loss) | 2,200 | 712 | 1,441 | 144 | 119 | 122 | 2,539 | (339) |
(1) Revised balances in Spain, Rest of Business and Corporate Center.
| MAIN BALANCE-SHEET ITEMS AND RISK-WEIGHTED ASSETS BY BUSINESS AREA (MILLIONS OF EUROS) | |||||||||
|---|---|---|---|---|---|---|---|---|---|
BBVA Group | ∑ Business areas | Corporate Center | Deletions |
||||||
| Spain | Mexico | Turkey | South America | Rest of Business |
|||||
| 31-03-25 | |||||||||
| Loans and advances to customers | 417,266 | 184,624 | 88,522 | 47,892 | 47,515 | 50,152 | 418,705 | 491 | (1,931) |
| Deposits from customers | 455,708 | 228,546 | 86,731 | 62,375 | 50,317 | 28,032 | 456,001 | 1,693 | (1,986) |
| Off-balance sheet funds | 196,989 | 110,547 | 58,655 | 18,572 | 8,559 | 655 | 196,988 | 1 | — |
| Total assets/liabilities and equity | 772,863 | 405,324 | 162,908 | 85,975 | 72,915 | 64,826 | 791,947 | 28,790 | (47,875) |
| RWAs | 395,352 | 121,219 | 87,158 | 65,961 | 54,983 | 36,814 | 366,135 | 29,217 | — |
| 31-12-24 | |||||||||
| Loans and advances to customers | 412,477 | 179,667 | 88,725 | 48,299 | 46,846 | 50,392 | 413,930 | 297 | (1,750) |
| Deposits from customers | 447,646 | 226,391 (1) | 84,949 | 58,095 | 50,738 | 27,432 | 447,605 | 2,057 (1) | (2,016) (1) |
| Off-balance sheet funds | 192,604 (1) | 108,694 (1) | 57,253 | 18,076 | 7,936 | 645 | 192,604 | 1 | — |
| Total assets/liabilities and equity | 772,402 | 411,620 (1) | 168,470 | 82,782 | 73,997 | 66,534 | 803,404 | 30,777 (1) | (61,779) (1) |
| RWAs | 394,468 | 120,661 (1) | 92,925 | 64,821 | 56,489 | 44,407 (1) | 379,304 | 15,164 (1) | — |
(1) Revised balances.
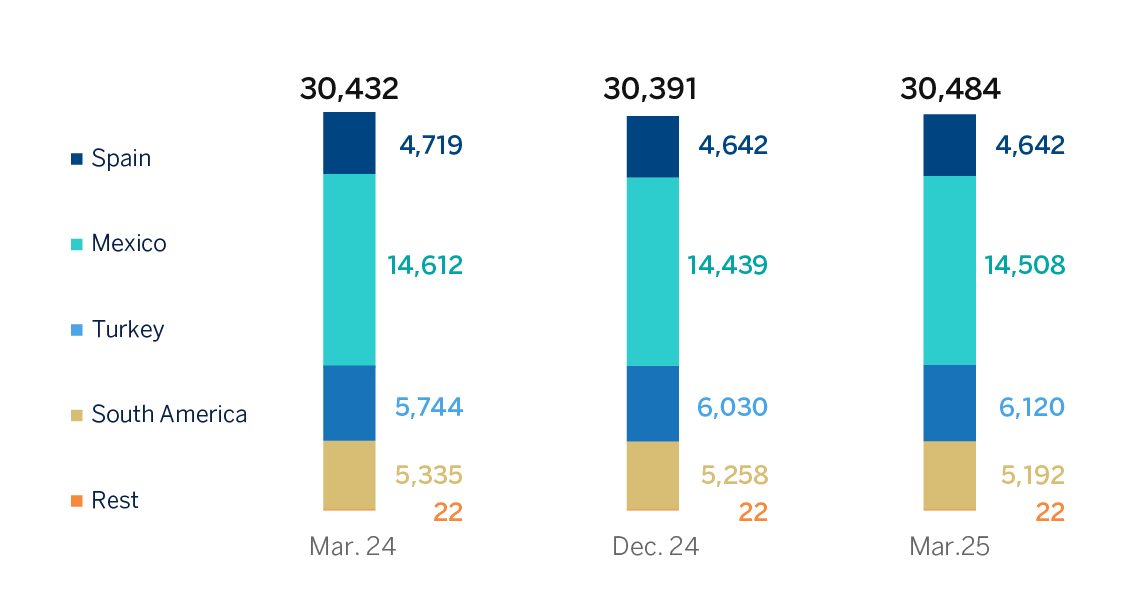
NUMBER OF EMPLOYEES
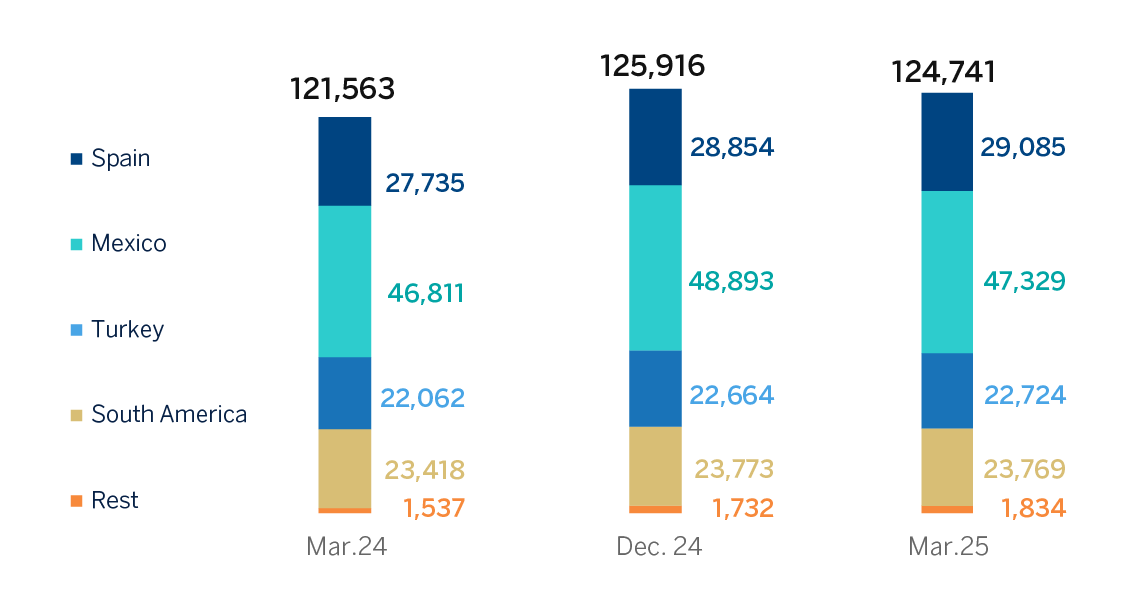
NUMBER OF BRANCHES
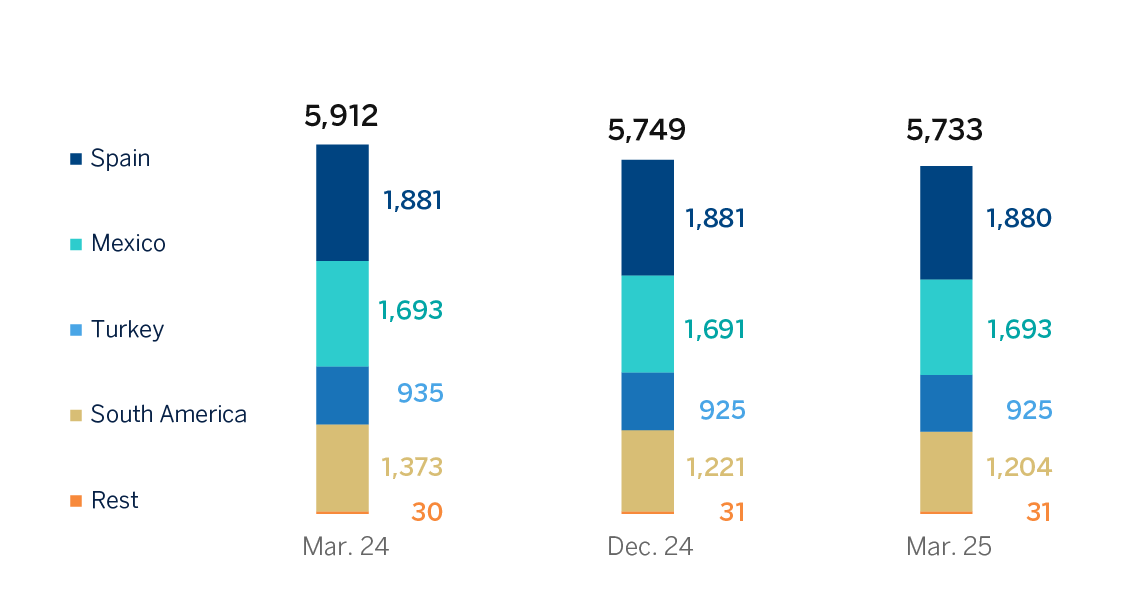
NUMBER OF ATMS