
Spain
Highlights
- Growth in lending and stability of customer funds in the quarter
- Year-on-year improvement of the efficiency ratio
- Good behavior of the risk indicators in the quarter
- Attributable profit above €1 billion
BUSINESS ACTIVITY (1)
(VARIATION COMPARED TO 31-12-24)
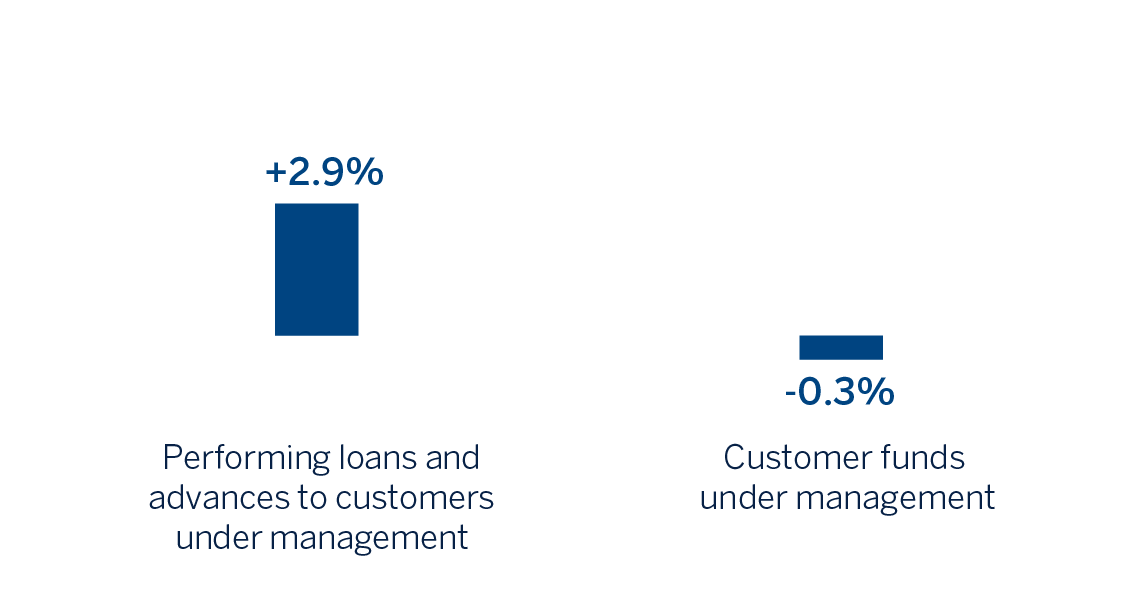
(1) Excluding repos.
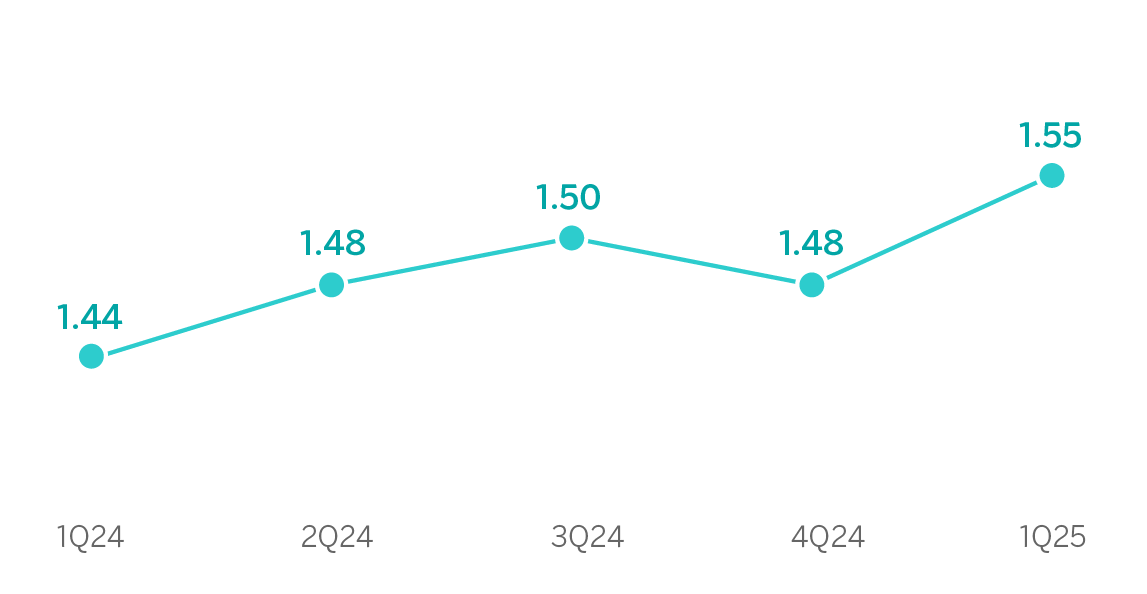
NET INTEREST INCOME / AVERAGE TOTAL ASSETS
(PERCENTAGE)
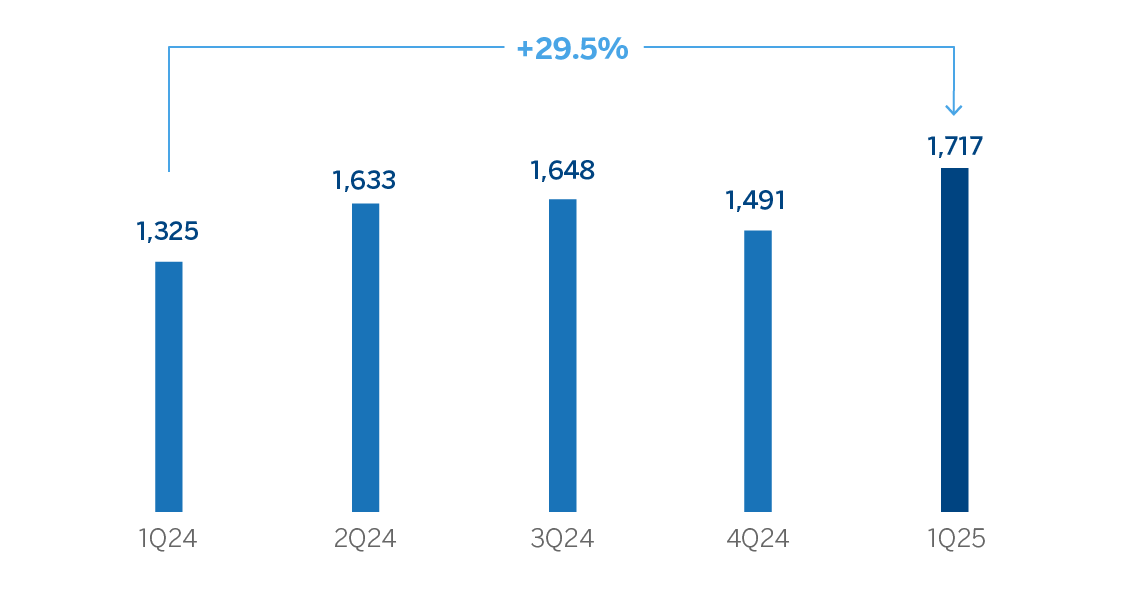
OPERATING INCOME
(MILLIONS OF EUROS)
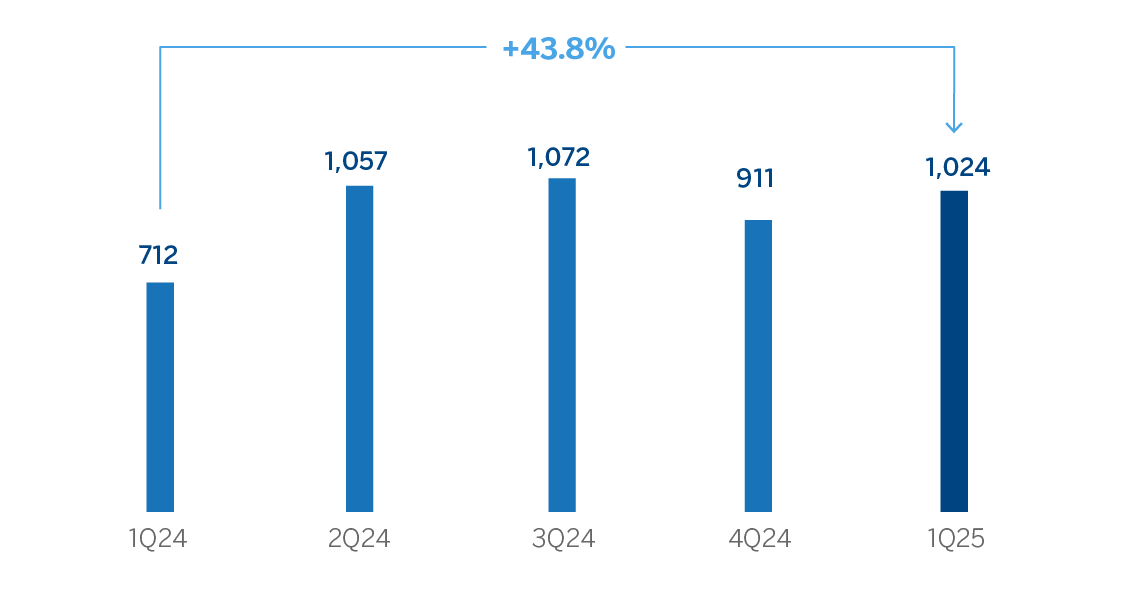
NET ATTRIBUTABLE PROFIT (LOSS)
(MILLIONS OF EUROS)
| FINANCIAL STATEMENTS AND RELEVANT BUSINESS INDICATORS (MILLIONS OF EUROS AND PERCENTAGE) | |||
|---|---|---|---|
| Income statement | 1Q25 | ∆ % | 1Q24 (1) |
| Net interest income | 1,607 | 1.2 | 1,587 |
| Net fees and commissions | 590 | 6.8 | 552 |
| Net trading income | 248 | 16.7 | 212 |
| Other operating income and expenses | 89 | n.s. | (209) |
| Of which: Insurance activities | 103 | 6.5 | 97 |
| Gross income | 2,533 | 18.2 | 2,143 |
| Operating expenses | (816) | (0.1) | (817) |
| Personnel expenses | (431) | 2.9 | (419) |
| Other administrative expenses | (292) | (3.9) | (304) |
| Depreciation | (93) | (1.0) | (94) |
| Operating income | 1,717 | 29.5 | 1,325 |
| Impairment on financial assets not measured at fair value through profit or loss | (139) | (15.7) | (164) |
| Provisions or reversal of provisions and other results | (26) | (16.8) | (31) |
| Profit (loss) before tax | 1,553 | 37.4 | 1,130 |
| Income tax | (528) | 26.4 | (417) |
| Profit (loss) for the period | 1,025 | 43.8 | 713 |
| Non-controlling interests | (1) | 11.6 | (1) |
| Net attributable profit (loss) | 1,024 | 43.8 | 712 |
Balance sheets | 31-03-25 | ∆ % | 31-12-24 (1) |
| Cash, cash balances at central banks and other demand deposits | 13,230 | 3.9 | 12,734 |
| Financial assets designated at fair value | 105,386 | (3.8) | 109,569 |
| Of which: Loans and advances | 37,178 | 4.5 | 35,564 |
| Financial assets at amortized cost | 246,576 | 3.9 | 237,279 |
| Of which: Loans and advances to customers | 184,624 | 2.8 | 179,667 |
| Inter-area positions | 33,364 | (25.0) | 44,464 |
| Tangible assets | 2,769 | (0.4) | 2,781 |
| Other assets | 4,000 | (16.6) | 4,793 |
| Total assets/liabilities and equity | 405,324 | (1.5) | 411,620 |
| Financial liabilities held for trading and designated at fair value through profit or loss | 68,956 | (8.2) | 75,143 |
| Deposits from central banks and credit institutions | 28,054 | — | 28,067 |
| Deposits from customers | 228,546 | 1.0 | 226,391 |
| Debt certificates | 47,773 | 0.7 | 47,424 |
| Inter-area positions | — | — | — |
| Other liabilities | 16,831 | (13.5) | 19,448 |
| Regulatory capital allocated | 15,165 | 0.1 | 15,145 |
Relevant business indicators | 31-03-25 | ∆ % | 31-12-24 |
| Performing loans and advances to customers under management (2) | 181,850 | 2.9 | 176,720 |
| Non-performing loans | 7,467 | (3.0) | 7,700 |
| Customer deposits under management (1) (2) | 217,158 | (1.3) | 219,923 |
| Off-balance sheet funds (1) (3) | 110,547 | 1.7 | 108,694 |
| Risk-weighted assets (1) | 121,219 | 0.5 | 120,661 |
| Efficiency ratio (%) | 32.2 | 35.4 | |
| NPL ratio (%) | 3.5 | 3.7 | |
| NPL coverage ratio (%) | 61 | 59 | |
| Cost of risk (%) | 0.30 | 0.38 | |
(1) Revised balances. For more information, please refer to the “Business Areas” section.
(2) Excluding repos.
(3) Includes mutual funds, customer portfolios and pension funds.
Macro and industry trends
Economic activity continued to show dynamism at the beginning of 2025, largely due to services exports, private consumption and the increase in the active population caused by factors such as greater migratory flows. In this context, growth could reach 2.8% this year. Annual inflation, which reached 2.3% in March, will probably remain slightly above 2.0% in 2025. Spain is less exposed than other European countries to an eventual reduction in demand for imported goods from the United States. However, a sharper increase in the United States tariffs could lead to a further deceleration in growth, mainly due to the deterioration of the global economic environment, although its effect could be partly mitigated by fiscal stimulus measures and increased defense spending.
Regarding the banking system, with data at the end of February 2025, the volume of credit to the private sector grew by 1.4% year-on-year, with greater growth in the loan portfolio to households (+1.9%) than in the loan portfolio to non-financial corporations (+1.3%). In 2024, credit growth in the system was recorded for the first time since 2009 (with the exception of 2020 due to COVID support measures), a trend which has been confirmed in the first months of 2025. Customer deposits increased by 7.2% year-on-year in February 2025, due to a 6.1% rise in demand deposits and a 13.8% increase in time deposits. The NPL ratio stood at 3.33% in January 2025, 29 basis points lower than the figure in January of the previous year. It should also be noted that the system maintains comfortable levels of solvency and liquidity.
Activity
The most relevant aspects related to the area's activity during the first quarter of 2025 were:
- Lending activity grew by 2.9%, compared to the end of 2024. Despite the seasonality of the first quarter, all segments showed higher balances as of March 31, 2025 compared to the previous year, although growth in corporate banking and CIB (+8.0%), and financing to medium-sized companies (+3.4%) stood out above other segments.
- Regarding credit quality, the NPL ratio decreased 22 basis points compared to the end of 2024, and stood at 3.5% due to the reduction in the non-performing balance as a result of a higher volume of write-offs and contained net entries in NPLs. For its part, the coverage ratio increased by 119 basis points to 61% at the end of March 2024, due to the decline in the non-performing balance in the retail portfolio.
- Total customer funds remained flat (-0.3% in the first quarter of 2025) with growth in off-balance sheet funds (+1.7%, supported by high net contributions) and a fall in customer deposits (-1.3%, mainly due to lower balances deposited by public institutions).
Results
Spain generated a net attributable profit of €1,024m in the first three months of 2025, which is 43.8% above the result achieved in the same period of 2024, driven by the recurring revenues from the banking business.
The most relevant aspects of the year-on-year changes in the area's income statement at the end of March 2025 were:
- Net interest income grew by 1.2%, favored by the higher contribution from the securities portfolio and the lower cost of liabilities, which together offset the reduction of the credit performance, as a result of the subsequent downward revisions in interest rates made by the ECB.
- Fees and Commissions grew by 6.8% compared to the first quarter of the previous year. Of particular relevance was the contribution of fees from asset management, and to a lesser extent, securities and insurance fees.
- Growth in the NTI contribution (+16.7%), mainly as a result of the improved performance of the Global Markets unit.
- The year-on-year comparison of the aggregate other operating income and expenses is affected by the recording in 2024 of the annual amount of the temporary tax on credit institutions and financial credit institutions for €285m.
- Operating expenses remained flat (-0.1% year-over-year), with growth in personnel expenses offset by a decrease in general expenses. This slight decrease, combined with double-digit gross margin growth (+18.2%), led to a year-over-year improvement of 591 basis points in the efficiency ratio.
- Impairment on financial asset decreased by 15.7%, as a result of lower requirements associated with the retail portfolio, contributing to a cumulative cost of risk at the end of March 2025 of 0.30%, 8 basis points lower than at the end of December.
- Finally, the accrual for the first quarter of 2025 of the new tax on net interest income and commissions, amounting to approximately €85m, is included in income tax.