
South America
Highlights
- Growth in lending activity and customer funds
- Lower year-on-year hyperinflation adjustment in Argentina in the other operating income and expenses line
- Decrease of the loan loss provisions and improvement of risk indicators
- Increase in the net attributable profit in all countries within this business area
BUSINESS ACTIVITY (1)
(VARIATION AT CONSTANT EXCHANGE RATES COMPARED TO 31-12-24)
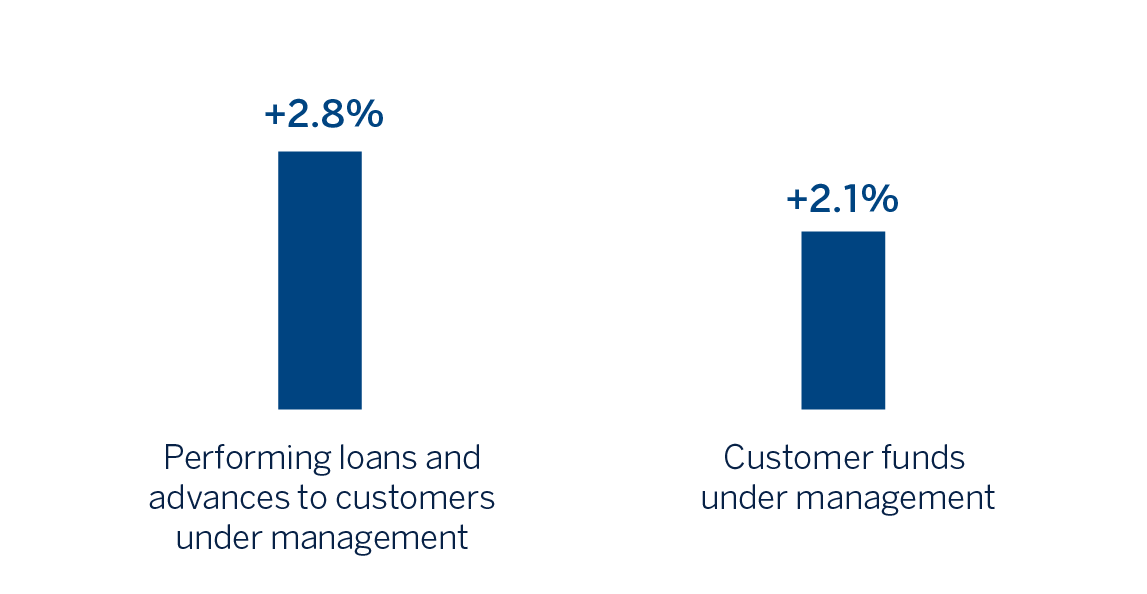
(1) Excluding repos.
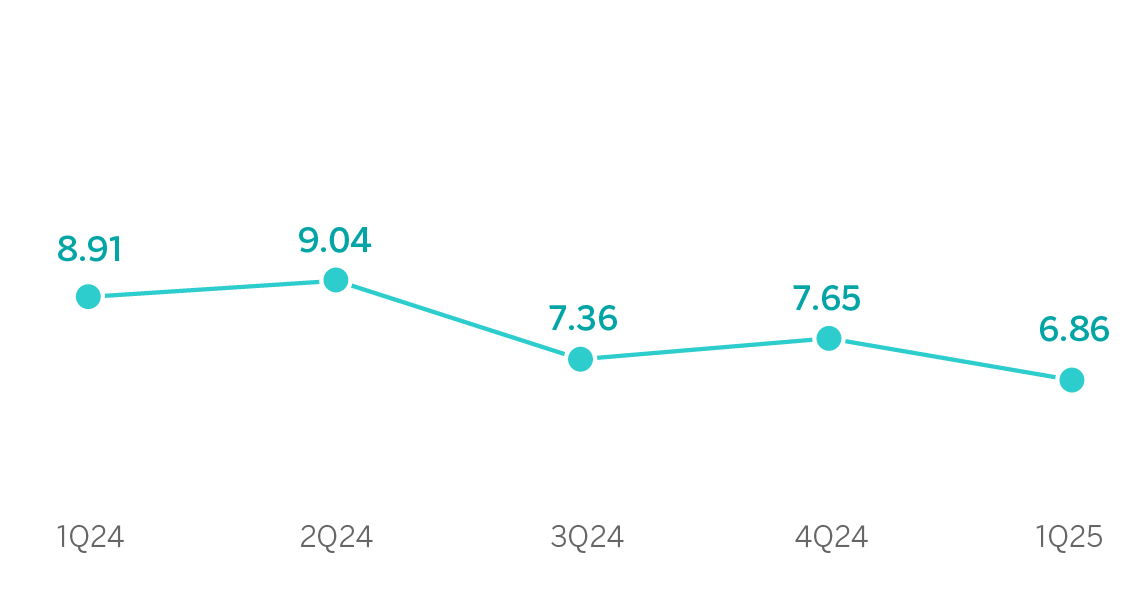
NET INTEREST INCOME / AVERAGE TOTAL ASSETS
(PERCENTAGE AT CONSTANT EXCHANGE RATES)
OPERATING INCOME
(MILLIONS OF EUROS AT CURRENT EXCHANGE RATES)
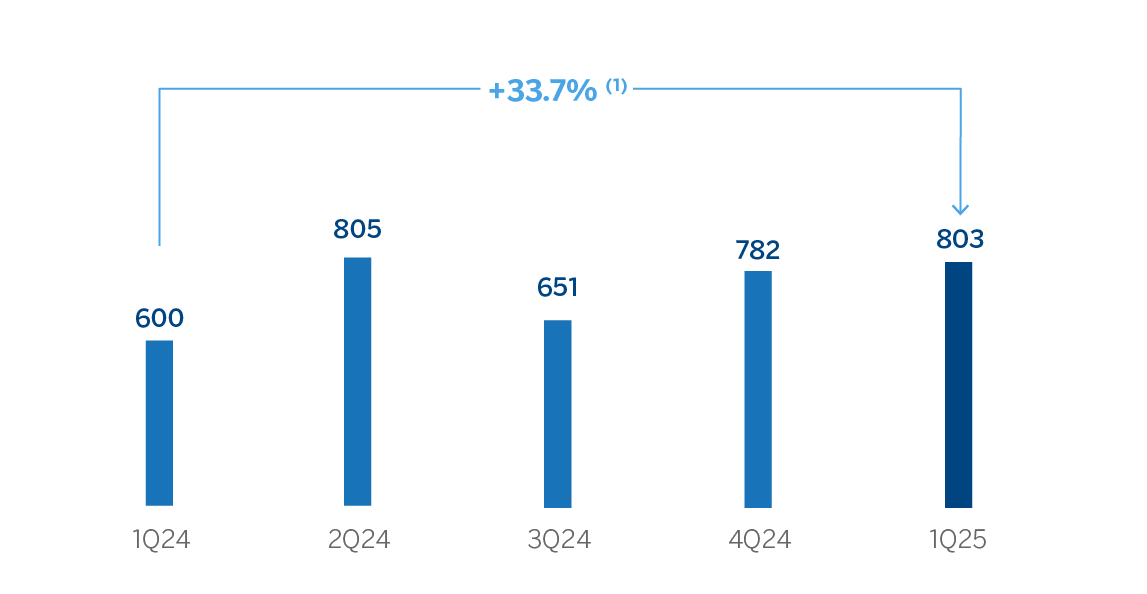
(1) At constant exchange rates: +71.6%.
NET ATTRIBUTABLE PROFIT (LOSS)
(MILLIONS OF EUROS AT CURRENT EXCHANGE RATES)
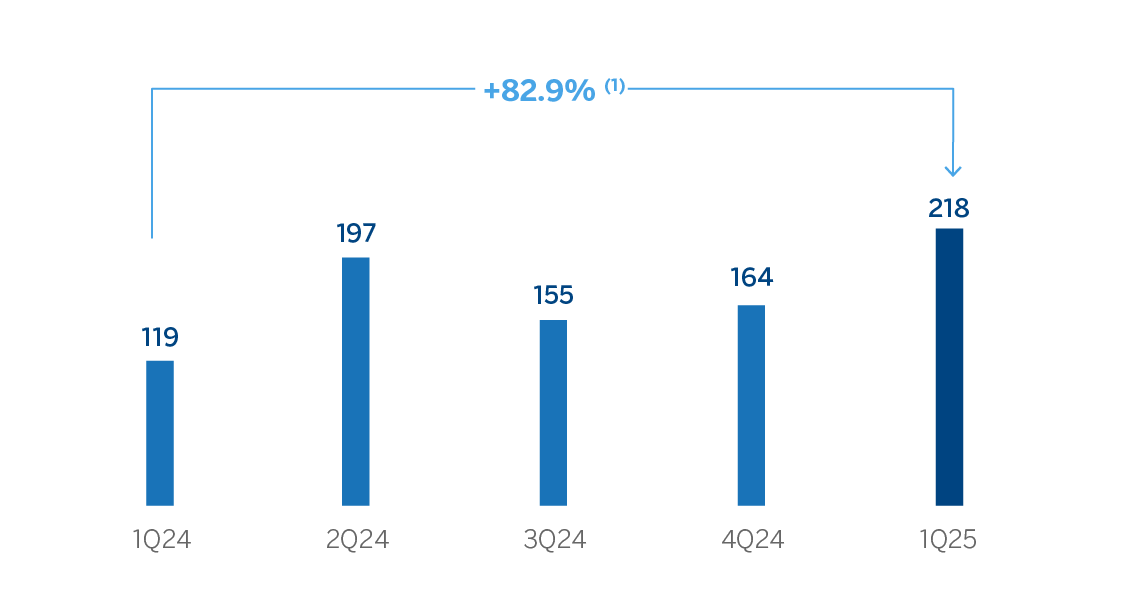
(1) At constant exchange rates: +236.2%.
| FINANCIAL STATEMENTS AND RELEVANT BUSINESS INDICATORS (MILLIONS OF EUROS AND PERCENTAGE) | ||||
|---|---|---|---|---|
| Income statement | 1Q25 | ∆ % | ∆ % (1) | 1Q24 |
| Net interest income | 1,231 | (20.9) | (12.4) | 1,555 |
| Net fees and commissions | 227 | 18.0 | 23.0 | 193 |
| Net trading income | 188 | (4.2) | 7.4 | 196 |
| Other operating income and expenses | (208) | (72.0) | (71.5) | (744) |
| Gross income | 1,438 | 19.8 | 39.0 | 1,201 |
| Operating expenses | (635) | 5.8 | 12.2 | (601) |
| Personnel expenses | (275) | 0.5 | 7.7 | (273) |
| Other administrative expenses | (305) | 9.5 | 16.2 | (279) |
| Depreciation | (55) | 14.1 | 13.7 | (49) |
| Operating income | 803 | 33.7 | 71.6 | 600 |
| Impairment on financial assets not measured at fair value through profit or loss | (297) | (16.2) | (14.9) | (354) |
| Provisions or reversal of provisions and other results | 6 | n.s. | n.s. | (45) |
| Profit (loss) before tax | 512 | 154.7 | n.s. | 201 |
| Income tax | (148) | n.s. | n.s. | (6) |
| Profit (loss) for the period | 365 | 87.3 | 217.7 | 195 |
| Non-controlling interests | (146) | 94.2 | 193.5 | (75) |
| Net attributable profit (loss) | 218 | 82.9 | 236.2 | 119 |
Balance sheets | 31-03-25 | ∆ % | ∆ % (1) | 31-12-24 |
| Cash, cash balances at central banks and other demand deposits | 7,241 | -18.7 | -16.7 | 8,906 |
| Financial assets designated at fair value | 11,216 | 3.0 | 5.0 | 10,884 |
| Of which: Loans and advances | 220 | 7.5 | 6.4 | 205 |
| Financial assets at amortized cost | 50,372 | 0.8 | 2.1 | 49,983 |
| Of which: Loans and advances to customers | 47,515 | 1.4 | 2.7 | 46,846 |
| Tangible assets | 1,239 | -2.9 | -2.0 | 1,277 |
| Other assets | 2,847 | -3.4 | -2.2 | 2,948 |
| Total assets/liabilities and equity | 72,915 | (1.5) | — | 73,997 |
| Financial liabilities held for trading and designated at fair value through profit or loss | 1,551 | (24.7) | (25.2) | 2,060 |
| Deposits from central banks and credit institutions | 4,027 | (6.2) | (5.6) | 4,292 |
| Deposits from customers | 50,317 | (0.8) | 0.7 | 50,738 |
| Debt certificates | 4,215 | 12.4 | 13.0 | 3,752 |
| Other liabilities | 5,515 | (9.1) | (6.4) | 6,066 |
| Regulatory capital allocated | 7,289 | 2.8 | 4.4 | 7,090 |
Relevant business indicators | 31-03-25 | ∆ % | ∆ % (1) | 31-12-24 |
| Performing loans and advances to customers under management ⁽²⁾ | 47,373 | 1.5 | 2.8 | 46,663 |
| Non-performing loans | 2,296 | (3.8) | (3.4) | 2,387 |
| Customer deposits under management ⁽³⁾ | 50,317 | (0.8) | 0.7 | 50,738 |
| Off-balance sheet funds ⁽⁴⁾ | 8,559 | 7.8 | 11.0 | 7,936 |
| Risk-weighted assets | 54,983 | (2.7) | (1.3) | 56,489 |
| Efficiency ratio (%) | 44.2 | 47.5 | ||
| NPL ratio (%) | 4.3 | 4.5 | ||
| NPL coverage ratio (%) | 90 | 88 | ||
| Cost of risk (%) | 2.30 | 2.87 | ||
(1) At constant exchange rate.
(2) Excluding repos.
(3) Excluding repos and including specific marketable debt securities.
(4) Includes mutual funds and customer portfolios in Colombia and Peru.
| SOUTH AMERICA. DATA PER COUNTRY (MILLIONS OF EUROS) | |||||||||
|---|---|---|---|---|---|---|---|---|---|
| Country | 1Q25 | ∆ % | ∆ % (1) | 1Q24 | 1Q25 | ∆ % | ∆ % (1) | 1Q24 | |
| Argentina | 220 | 98.2 | n.s. | 111 | 50 | 46.7 | n.s. | 34 | |
| Colombia | 152 | 4.4 | 8.3 | 146 | 33 | 67.5 | 73.7 | 20 | |
| Peru | 307 | 8.0 | 3.0 | 285 | 84 | 98.0 | 88.8 | 42 | |
| Other countries (2) | 123 | 110.0 | 116.6 | 59 | 51 | 122.3 | 135.0 | 23 | |
| Total | 803 | 33.7 | 71.6 | 600 | 218 | 82.9 | 236.2 | 119 | |
(1) Figures at constant exchange rates.
(2) Chile (Forum), Uruguay and Venezuela. Additionally, it includes eliminations and other charges.
| SOUTH AMERICA. RELEVANT BUSINESS INDICATORS PER COUNTRY (MILLIONS OF EUROS) | ||||||||
|---|---|---|---|---|---|---|---|---|
| 31-03-25 | 31-12-24 | 31-03-25 | 31-12-24 | 31-03-25 | 31-12-24 | |||
| Performing loans and advances to customers under management (1) (2) | 7,796 | 6,487 | 16,085 | 15,768 | 18,670 | 18,915 | ||
| Non-performing loans (1) | 140 | 95 | 922 | 976 | 1,052 | 1,117 | ||
| Customer deposits under management (1) (3) | 9,440 | 8,518 | 17,367 | 17,353 | 19,391 | 20,069 | ||
| Off-balance sheet funds (1) (4) | 3,093 | 2,624 | 2,640 | 2,565 | 2,823 | 2,520 | ||
| Risk-weighted assets | 11,098 | 11,037 | 18,788 | 18,868 | 19,285 | 20,384 | ||
| Efficiency ratio (%) | 52.2 | 59.5 | 45.9 | 46.9 | 38.2 | 36.5 | ||
| NPL ratio (%) | 1.7 | 1.4 | 5.3 | 5.7 | 4.7 | 4.9 | ||
| NPL coverage ratio (%) | 132 | 145 | 84 | 82 | 91 | 90 | ||
| Cost of risk (%) | 4.30 | 4.48 | 2.56 | 2.83 | 1.40 | 2.83 | ||
(1) Figures at constant exchange rates.
(2) Excluding repos.
(3) Excluding repos and including specific marketable debt securities.
(4) Includes mutual funds and customer portfolios (in Colombia and Peru).
Unless expressly stated otherwise, all the comments below on rates of change, for both activity and results, will be given at constant exchange rates. These rates, together with the changes at current exchange rates, can be found in the attached tables of the financial statements and relevant business indicators.
Activity and results
The most relevant aspects related to the area's activity during the first quarter of the year 2025 have been:
- Lending activity grew 2.8%, favored by the dynamism of commercial loans (+2.3%) and consumer loans (+3.8%).
- With regard to asset quality, the NPL ratio at regional level stood at 4.3%, which represents a decrease of 23 basis points compared to the previous quarter, favored by the reduction in the non-performing balance, with limited entries to NPLs offset by a good recovery performance, as well as by a higher volume of write-offs, mainly in Peru and Colombia. For its part, the coverage ratio for the area was 90%, which represents an increase of 177 basis points compared to the end of 2024.
- Customer funds under management increased at a rate of 2.1%, as higher time deposits (+5.2%), and the growth of off-balance sheet funds (+11.0%) offset the reduction in demand deposits (-2.1%).
South America generated a net attributable profit of €218m at the end of the first three months of 2025, which represents a year-on-year variation of +236.2%, derived from a less negative hyperinflation adjustment in Argentina and a better performance of fees and commissions, together with a more contained level of loan-loss provisions.
The impact of the adjustment for hyperinflation is the recording in the income statement of the loss on the net monetary position of the Argentine subsidiaries under "Other operating income and expenses" and amounted to €117m in the period from January-March 2025, much lower than the €655m recorded in the period from January-March 2024.
More detailed information on the most representative countries of the business area is provided below.
Argentina
Macro and industry trends
Significant fiscal consolidation, monetary astringency and relative exchange rate stability have contributed to a process of moderating inflation over the course of 2024, which has continued at the beginning of 2025. Also, there are increasing signs of a recovery in economic activity, which after falling 1.7% in 2024, should expand by around 5.5% in 2025, according to BBVA Research. The inflation reduction forecasts have taken hold and the forecast is for inflation to converge to around 35% by the end of 2025. Recently, within the framework of a new agreement with the International Monetary Fund, it was announced that most of the exchange controls would be lifted and the implementation of a floating exchange rate scheme with wide bands, which could contribute to the macroeconomic normalization process. With respect to the external environment, although the direct impact of U.S. tariffs could be relatively limited, the economy could be affected by a less favorable global context.
The banking system continues to grow at a high pace. With data at the end of March 2025, total lending was increased by 232% compared to March 2024, favored by consumer, corporate and, above all, mortgage portfolios, which grew by 245%, 215% and 314% year-on-year, respectively. For its part, deposits continue to decelerate, and at the end of March recorded a year-on-year growth of 88% year-on-year at the end of March. Finally, the NPL ratio improved notably to 1.63% at the end of January 2025 (189 basis points lower than in January 2024).
Activity and results
- Between January and March 2025, performing loans under management grew by 20.2%, driven by the growth in companies and consumption loans. At the end of March 2025, the NPL ratio stood at 1.7%, an increase of 32 basis points compared to the end of December 2024, which originated in the retail portfolios. The coverage ratio stood at 132%, lower than at the end of December 2024, as a result of the increase in the non-performing balance.
- On balance sheet funds grew by 10.8% during 2025, with growth in both demand deposits (+3.8%) and time deposits (+24.1%). For its part, mutual funds (off-balance resources) also had a good performance (+17.9% in the same period).
- The cumulative net attributable profit at the end of March 2025 stood at €50m, above that achieved in the same quarter of the previous year, due to a significantly lower hyperinflationary impact than at the end of March 2024. Net interest income was penalized by the evolution of the monetary policy rate, which was not offset by the higher lending volume. Net fee and commission income grew by 88.5%, driven by income from credit cards. On the other hand, there was a significantly less negative adjustment for hyperinflation (mainly reflected in the other operating income and expenses line) and higher expenses, both in personnel (fixed compensation to staff) and, especially, in general expenses, affected by inflation. Loan-loss provisions increased as a result of the growth in lending activity and higher requirements in the retail portfolio. However, the cost of risk stood at 4.30%, a decrease of 18 basis points in the quarter.
Colombia
Macro and industry trends
The recovery of economic growth has continued in recent months in a context of gradually falling inflation and interest rates. BBVA Research forecasts GDP growth of 2.5% in 2025, above the 1.7% growth recorded in 2024. Inflation, which reached 5.1% in March, is expected to continue to moderate, reaching a level close to 4.5% in December. In this context, interest rates, which have remained unchanged at 9.5% in recent months, are likely to be reduced again, converging to a level of around 8.5% at year-end. US tariffs could affect the economy, both because of their direct impact on the country (which is estimated to be relatively moderate), and because of a possible additional deterioration in the global environment.
Total credit growth in the banking system stood at 3.9% year-on-year in February 2025. As in previous months, the system's lending continued to be driven by credit to companies and housing loans, with growth of 8.7% and 6.0% respectively. As for consumer credit, the slowdown of recent quarters continues. With data as of February 2025, this portfolio showed a year-on-year fall of 2.2% On the other hand, total deposits grew by 6.4% year-on-year at the end of February 2025, with a more balanced evolution by portfolios than in previous quarters. Thus, demand and time deposits grew by 5.9% and 6.9% year-on-year respectively. The system's NPL ratio has slightly improved in the last few months placing at 4.69% in February 2025, 43 basis points lower than in the same month of the previous year.
Activity and results
- Lending activity grew at a rate of 2.0% compared to the end of 2024, mainly due to the favorable evolution of corporate loans (+6.7%), which offset the deleveraging of individuals in mortgages and consumption. In terms of credit quality indicators, they improved with respect to the end of 2024: the NPL ratio stood at 5.3%, a decrease of 40 basis points with respect to the previous quarter, as a result of more contained entries into NPLs in the retail portfolio, as well as the recoveries and write-offs carried out in the quarter. Coverage thus rose 203 basis points in the quarter to 84%.
- Customer deposits also remained stable, showing a slight growth of 0.1% compared to year-end 2024, mainly thanks to the growth of time deposits (+6.5%) and, to a lesser extent, to the increase of off-balance sheet funds (+2.9%).
- The cumulative net attributable profit at the end of March 2025 stood at 33 million euros, 73.7% higher than at the end of the same period of the previous year, favored by higher efficiency in expenses, and a lower level of provisions for impairment of financial assets associated with the lower requirements of the retail portfolio as a result of lower entries into NPLs. Finally, the cost of risk fell 27 basis points in the quarter to 2.56%.
Peru
Macro and industry trends
BBVA Research estimates that GDP will grow by 3.1% in 2025. Controlled inflation (1.3% in March and expected to be close to 2.0% thereafter) and low interest rates (4.75% in April, a level already very close to the terminal interest rate), as well as relatively high copper prices and an improved outlook for investment support growth expectations. The United States tariffs could affect the economy, mainly due to a possible further deterioration in the global environment.
Total lending in the Peruvian banking system broke the trend of recent quarters and increased by 2.2% year-on-year in February 2025. The performance by portfolios continues to be uneven, with a fall in consumer loan portfolio (-0.9%) and growth in the corporate loan portfolios (+2.4%), and mortgage loan portfolio (+5.3% year-on-year). The system's total deposits increased 9.5% year-on-year in February of this year, due to the strength of demand deposits (+12.6% year-on-year), which offset the lower growth of time deposits (+4.0% year-on-year). Finally, the system's NPL ratio continue to decrease, reaching a rate of 3.67% in February 2025, 76 basis points better than in February 2024.
Activity and results
- Lending activity decreased 1.3% compared to the end of December 2024, mainly due to the renewals of corporate loans at the end of the last year, which caused the credit investment balance to fall by 5.0% in the quarter in this segment, although this was partially offset by the growth in mortgage and consumer loans. In terms of credit quality indicators, the NPL ratio fell compared to the end of December 2024 (-24 basis points) placing at 4.7%, as a result of more moderate inflows and the evolution of the pass to failures. For its part, the NPL coverage ratio stood at 91%, which represents an increase of 133 basis points compared to the end of December.
- Customers funds under management decreased by (-1.7%) during the first three months of 2025, with lower balances in demand and time deposits (-3.4%) which were partially offset by growth in off-balance sheet funds (+12.0%).
- BBVA Peru's cumulative attributable profit stood at €84m at the end of March 2025, which represents an increase of 88.8% compared to the first quarter of 2024 due to lower provisions for impairment of financial assets, which were significantly lower than in the first quarter of 2024 (-57.8%) due, among other factors, to a lower retail products requirement as a result of the improved credit quality of the portfolio. Thus, the cost of risk stood at 1.40%, 143 basis points lower than at the end of December. In addition, net interest income showed stability and the favorable evolution of NTI and the release of provisions favored the evolution of net attributable profit.