
Turkey
Highlights
- Increase in lending activity and customer funds
- Growth in net interest income supported by improved customer spreads in Turkish lira
- Lower year-on-year impact from hyperinflation
- Year-on-year growth in attributable profit
BUSINESS ACTIVITY (1)
(VARIATION AT CONSTANT EXCHANGE RATE COMPARED TO 31-12-24)
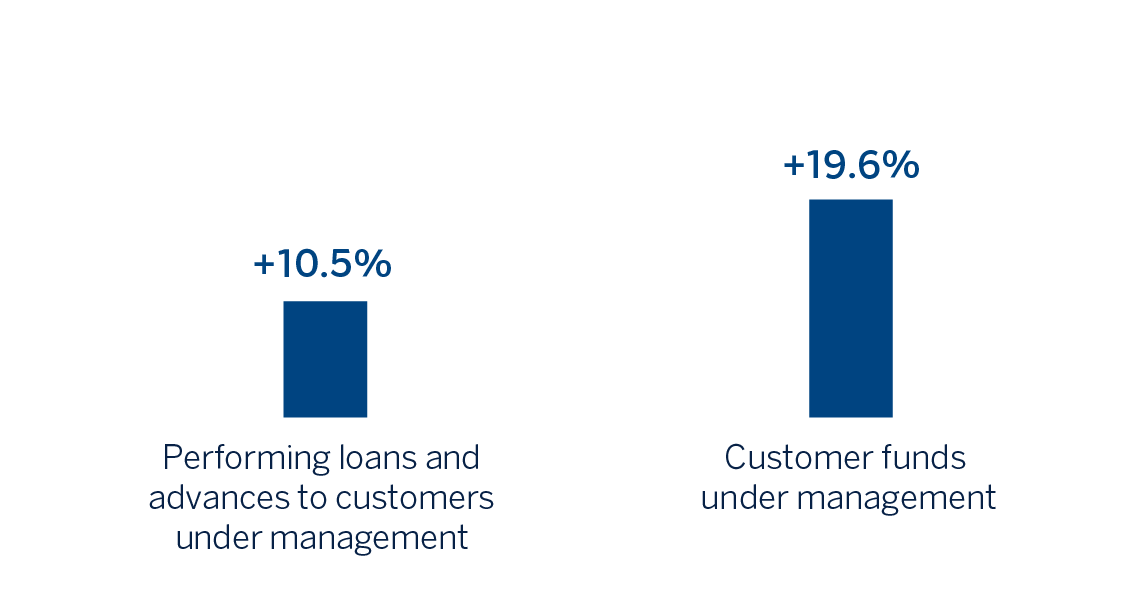
(1) Excluding repos.
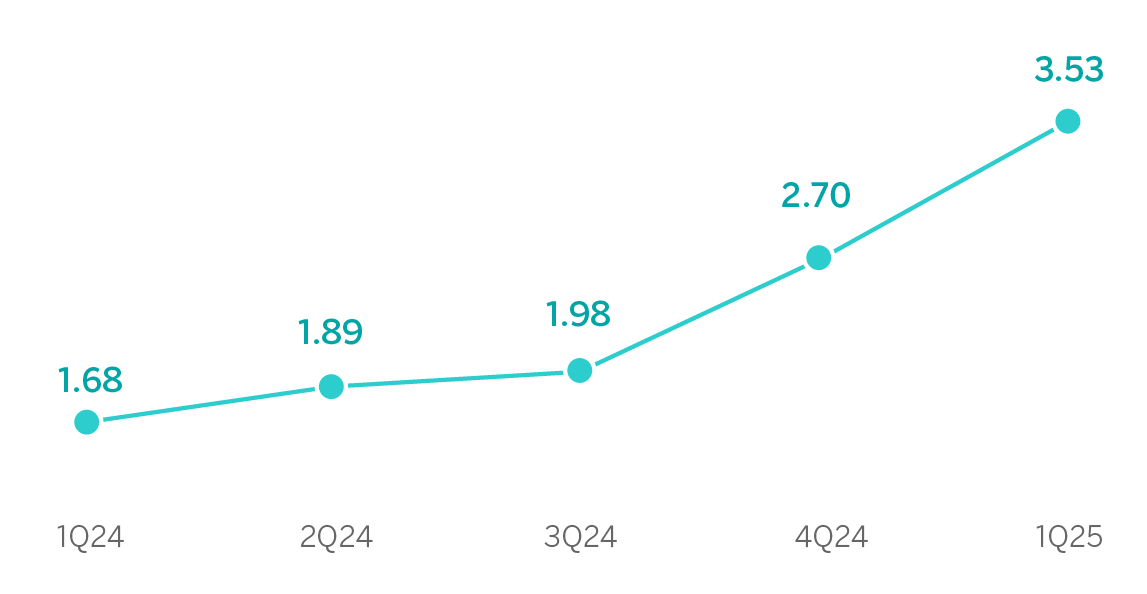
NET INTEREST INCOME / AVERAGE TOTAL ASSETS
(PERCENTAGE AT CONSTANT EXCHANGE RATE)
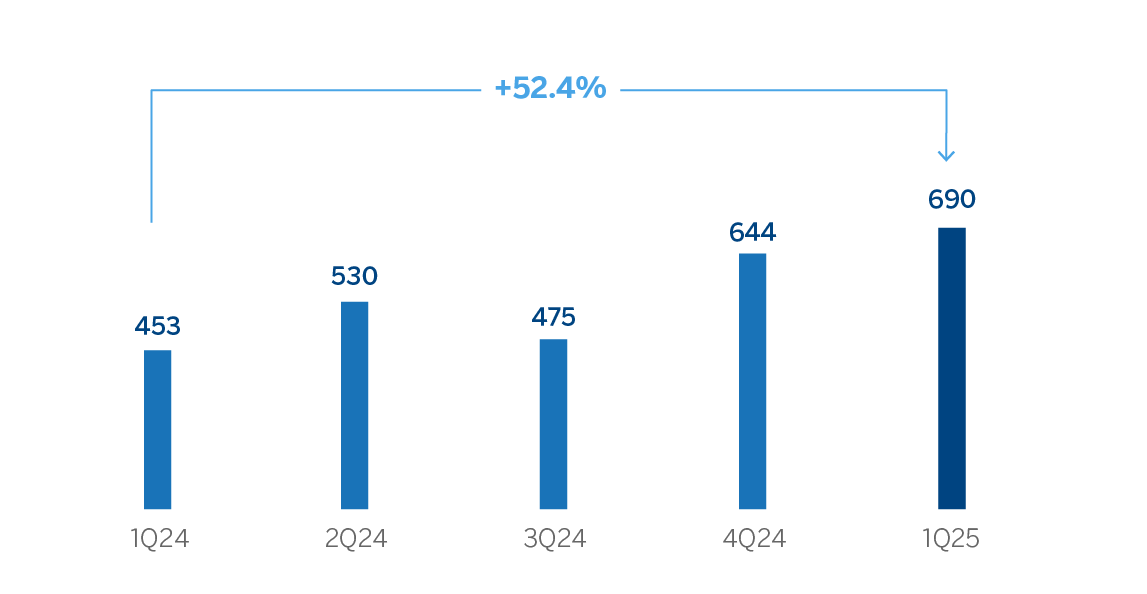
OPERATING INCOME
(MILLIONS OF EUROS AT CURRENT EXCHANGE RATE)
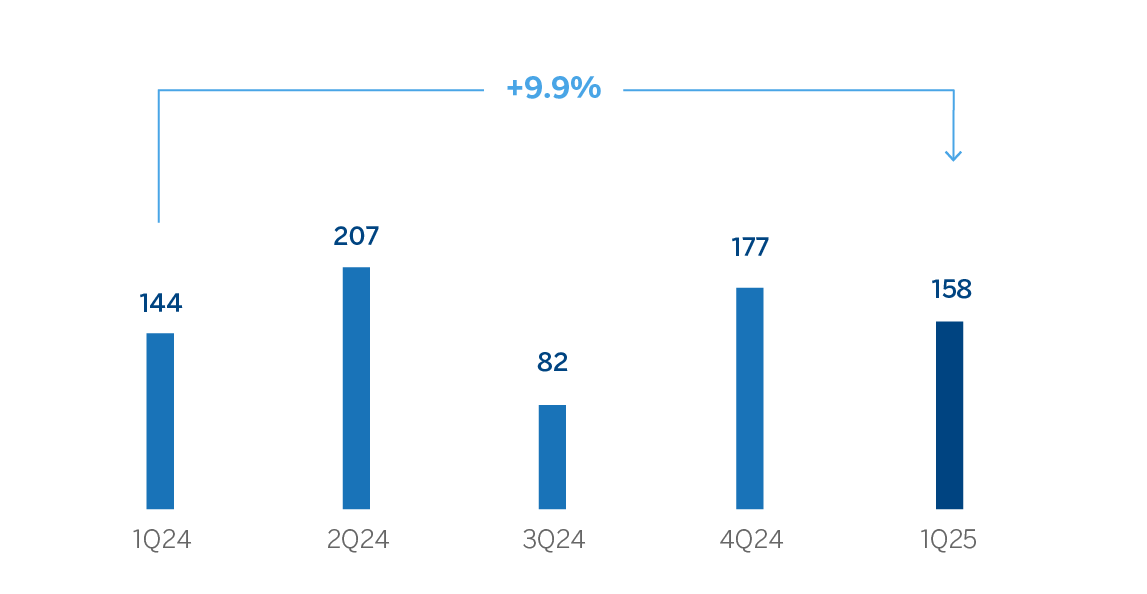
NET ATTRIBUTABLE PROFIT (LOSS)
(MILLIONS OF EUROS AT CURRENT EXCHANGE RATE)
| FINANCIAL STATEMENTS AND RELEVANT BUSINESS INDICATORS (MILLIONS OF EUROS AND PERCENTAGE) | ||||
|---|---|---|---|---|
| Income statement | 1Q25 | ∆ % | ∆ % (1) | 1Q24 |
| Net interest income | 701 | 152.7 | 193.2 | 277 |
| Net fees and commissions | 549 | 29.9 | 51.6 | 423 |
| Net trading income | 124 | (60.9) | (54.3) | 316 |
| Other operating income and expenses | (107) | (9.8) | (42.9) | (119) |
| Gross income | 1,267 | 41.2 | 85.2 | 897 |
| Operating expenses | (577) | 29.8 | 49.9 | (444) |
| Personnel expenses | (333) | 31.1 | 52.7 | (254) |
| Other administrative expenses | (185) | 27.1 | 47.9 | (146) |
| Depreciation | (59) | 31.0 | 41.4 | (45) |
| Operating income | 690 | 52.4 | 130.5 | 453 |
| Impairment on financial assets not measured at fair value through profit or loss | (234) | 211.6 | 263.5 | (75) |
| Provisions or reversal of provisions and other results | (2) | n.s. | n.s. | 36 |
| Profit (loss) before tax | 453 | 9.7 | 70.9 | 413 |
| Income tax | (265) | 8.6 | 28.7 | (244) |
| Profit (loss) for the period | 189 | 11.1 | 216.8 | 170 |
| Non-controlling interests | (31) | 18.0 | 202.0 | (26) |
| Net attributable profit (loss) | 158 | 9.9 | 219.9 | 144 |
Balance sheets | 31-03-25 | ∆ % | ∆ % (1) | 31-12-24 |
| Cash, cash balances at central banks and other demand deposits | 10,536 | 19.3 | 33.3 | 8,828 |
| Financial assets designated at fair value | 4,840 | 7.5 | 20.0 | 4,503 |
| Of which: Loans and advances | 8 | n.s. | n.s. | 2 |
| Financial assets at amortized cost | 66,113 | 1.9 | 13.8 | 64,893 |
| Of which: Loans and advances to customers | 47,892 | (0.8) | 10.8 | 48,299 |
| Tangible assets | 1,998 | (3.2) | 4.0 | 2,064 |
| Other assets | 2,488 | (0.2) | 10.9 | 2,494 |
| Total assets/liabilities and equity | 85,975 | 3.9 | 15.9 | 82,782 |
| Financial liabilities held for trading and designated at fair value through profit or loss | 1,854 | (4.6) | 6.6 | 1,943 |
| Deposits from central banks and credit institutions | 3,775 | (11.5) | (1.2) | 4,267 |
| Deposits from customers | 62,375 | 7.4 | 19.9 | 58,095 |
| Debt certificates | 4,790 | 6.0 | 18.4 | 4,517 |
| Other liabilities | 4,421 | (22.6) | (14.9) | 5,714 |
| Regulatory capital allocated | 8,759 | 6.2 | 18.6 | 8,245 |
Relevant business indicators | 31-03-25 | ∆ % | ∆ % (1) | 31-12-24 |
| Performing loans and advances to customers under management (2) | 47,726 | (1.1) | 10.5 | 48,242 |
| Non-performing loans | 2,066 | 2.5 | 14.5 | 2,016 |
| Customer deposits under management (2) | 62,297 | 8.4 | 21.2 | 57,443 |
| Off-balance sheet funds (3) | 18,572 | 2.7 | 14.8 | 18,076 |
| Risk-weighted assets | 65,961 | 1.8 | 13.5 | 64,821 |
| Efficiency ratio (%) | 45.5 | 50.1 | ||
| NPL ratio (%) | 3.2 | 3.1 | ||
| NPL coverage ratio (%) | 93 | 96 | ||
| Cost of risk (%) | 1.89 | 1.27 | ||
(1) At constant exchange rate.
(2) Excluding repos.
(3) Includes mutual funds and pension funds.
Macro and industry trends
Growth has surprised positively in recent months and inflation has moderated to 38.1% in March. In a context of commitment to orthodox economic policies, BBVA Research has revised up its forecast for GDP growth in 2025 from 2.5% to 3.5% (following 3.2% growth in 2024), and estimates that inflation will continue to moderate to around 31% in December. Monetary conditions, which were tightened to counter financial volatility stemming from the recent sociopolitical turmoil, could ease again from mid-2025, allowing for a reduction in interest rates from 46% in April to levels close to 35% in December. Although the direct impact of US tariffs could be relatively limited, the economy could be affected by a less favorable global environment.
As for the Turkish banking system, it continues to be affected by the impact of inflation. The total volume of credit in the system increased by 36.2% year-on-year at the end of February 2025, at similar levels to the previous months. The stock of credit continued to be driven by consumer credit and credit card portfolios (+40.4% year-on-year) and by credit to companies (+35.4% year-on-year). Total deposits maintained the strength of the last few months and grew 31.9% year-on-year at the end of February 2025. Turkish lira deposits continued to grow strongly in the same month (+45.8%) while US dollar deposits grew more slowly (+11.4%). Dollarization decreased to 34.2% in February of this year from 40.4% a year earlier. The NPL ratio of the system remains well under control and stood at 2.11% in February 2025. With respect to the capital indicators, they remain at comfortable levels as of the same date.
Unless expressly stated otherwise, all comments below on rates of changes for both activity and results, will be presented at constant exchange rates. These rates, together with changes at current exchange rates, can be observed in the attached tables of the financial statements and relevant business indicators. For the conversion of these figures, the end of period exchange rate as of March 31, 2025 is used, reflecting the considerable depreciation by the Turkish lira in the last twelve months. Likewise, the Balance sheet, the Risk-Weighted Asset (RWA) and the equity are affected.
Activity16
The most relevant aspects related to the area’s activity in the first quarter of 2025 were:
- Lending activity (performing loans under management) increased by 10.5%, mainly driven by the growth in Turkish lira loans (+6.4%, below the quarterly inflation rate, which stood at 10.1%) and, to a lesser extent, by the growth of foreign currency loans (+5.5%). Within Turkish lira loans, credit cards and consumer loans continue to drive the growth, which grew at rates of 4.2% and 7.3%, respectively.
- In terms of asset quality, the NPL ratio increased by 7 basis points compared to the figure as of the end of 2024 to 3.2%, mainly as a result of the increase in non-performing balances in the retail portfolio, partially offset by wholesale recoveries and sales of impaired loans. Consequently, the NPL coverage ratio recorded a decrease of 270 basis points in the quarter to 93% as of March 31, 2025.
- Customer deposits increased by 21.2%, with growth in both Turkish lira balances (+18.3%), as well as US dollar deposits (+21.0%), the latter mainly due to deposits from companies. Additionally, off-balance sheet funds grew 14.8% in the quarter.
Results
Turkey generated a net attributable profit of €158m during the first three months of 2025, which compares favorably with the result achieved in the first quarter of the previous year as a result of the good performance of recurring revenues in banking business (net interest income and net fees and commissions).
As mentioned above, the year-on-year comparison of the accumulated income statement at the end of March 2025 at current exchange rate is affected by the depreciation of the Turkish lira in the last year (-14.8%). To isolate this effect, the highlights of the results of the first three months of 2025 at constant exchange rates are summarized below:
- Net interest income increased year-on-year, favored by the improvement of the Turkish lira customer spread and growth in lending activity. In addition, the central bank has increased the remuneration of certain Turkish lira reserves since February 2024.
- Net fees and commissions increased significantly, favored by the performance in payment systems fees, followed by asset management, insurances and guarantees.
- Lower NTI, due to lower revenues from currency positions and derivatives trading, partially offset by higher earnings from the Global Markets unit.
- The other operating income and expenses line had a balance of €-107m, which compares favorably with the previous year. This line incorporates, among others, the loss in the value of the net monetary position due to the country's inflation rate, together with its partial offset by the income derived from inflation-linked bonds (CPI linkers). The net impact of both effects was less negative at the end of the first quarter of 2025, compared with the same quarter of 2024. This line also includes the results of the subsidiaries of Garanti BBVA, whose contribution was increased compared to the first quarter of 2024.
- Operating expenses grew, mainly due to the growth in personnel expenses, linked to the growth in the workforce and a salary review in the context of high inflation. On the other hand, general expenses also increased, mainly due to the higher advertising expenditures and technology.
- Regarding the impairment on financial assets, it increased which is explained by the growth of the activity and higher requirements in retail portfolios, partially offset by the wholesale portfolios. Thus, the cumulative cost of risk as of March 31, 2025 stood at 1.89%.
- The provisions and other results line closed March 2025 at €-2m, which contrasts with the releases in the same period of the previous year, associated with significant recoveries from wholesale customers.
16 The variation rates of loans in Turkish lira and loans in foreign currency (U.S. dollars) are calculated based on local activity data and refer only refer to Garanti Bank and therefore exclude the subsidiaries of Garanti BBVA, mainly in Romania and Netherlands.