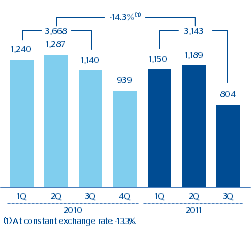
BBVA generated a net attributable profit for the third quarter of 2011 of €804m. There are two main factors that characterize the accounts for this period: on the one hand, the zero contribution from NTI; and on the other hand, the growth of the most recurrent earnings in the Group, i.e. the gross income excluding NTI or dividends. The following should be highlighted in this respect:
- The positive performance of net interest income, which was up 2.2% in the quarter. This is due to the positive contribution of emerging markets and the resilience of net interest income in developed countries.
- The greater contribution from net income by the equity method, thanks to the positive performance of CNCB.
- As a result, the quarterly gross income excluding NTI or dividends was €4,602m, continuing with the upward trend since the start of the year.
Net attributable profit
(Million euros)

- Finally, both operating expenses and impairment on financial assets were at similar levels to the previous quarter.
| Consolidated income statement: quarterly evolution (Million euros) |
||||||||
|---|---|---|---|---|---|---|---|---|
|
|
2011 |
|
2010 | |||||
|
|
3Q | 2Q | 1Q |
|
4Q | 3Q | 2Q | 1Q |
| Net interest income | 3,286 | 3,215 | 3,175 |
|
3,138 | 3,245 | 3,551 | 3,386 |
| Net fees and commissions | 1,143 | 1,167 | 1,114 |
|
1,135 | 1,130 | 1,166 | 1,106 |
| Net trading income | (25) | 336 | 752 |
|
252 | 519 | 490 | 633 |
| Dividend income | 50 | 259 | 23 |
|
227 | 45 | 231 | 25 |
| Income by the equity method | 150 | 123 | 121 |
|
124 | 60 | 94 | 57 |
| Other operating income and expenses | 22 | 62 | 79 |
|
70 | 85 | 47 | 93 |
| Gross income | 4,627 | 5,162 | 5,263 |
|
4,946 | 5,084 | 5,579 | 5,301 |
| Operating costs | (2,461) | (2,479) | (2,359) |
|
(2,325) | (2,262) | (2,262) | (2,118) |
| Personnel expenses | (1,325) | (1,306) | (1,276) |
|
(1,240) | (1,211) | (1,215) | (1,149) |
| General and administrative expenses | (920) | (964) | (887) |
|
(887) | (855) | (855) | (796) |
| Depreciation and amortization | (216) | (208) | (196) |
|
(199) | (197) | (192) | (174) |
| Operating income | 2,166 | 2,683 | 2,904 |
|
2,621 | 2,821 | 3,317 | 3,183 |
| Impairment on financial assets (net) | (904) | (962) | (1,023) |
|
(1,112) | (1,187) | (1,341) | (1,078) |
| Provisions (net) | (94) | (83) | (150) |
|
(75) | (138) | (99) | (170) |
| Other gains (losses) | (166) | (154) | (71) |
|
(273) | 113 | (88) | (72) |
| Income before tax | 1,002 | 1,484 | 1,659 |
|
1,162 | 1,609 | 1,789 | 1,862 |
| Income tax | (95) | (189) | (369) |
|
(127) | (359) | (431) | (510) |
| Net income | 907 | 1,295 | 1,290 |
|
1,034 | 1,250 | 1,358 | 1,352 |
| Non-controlling interests | (103) | (106) | (141) |
|
(96) | (110) | (70) | (113) |
| Net attributable profit | 804 | 1,189 | 1,150 |
|
939 | 1,140 | 1,287 | 1,240 |
| Basic earnings per share (euros) | 0.17 | 0.25 | 0.25 |
|
0.22 | 0.28 | 0.32 | 0.31 |
| Consolidated income statement (Million euros) |
|
|
|
|
|---|---|---|---|---|
|
|
January-Sep. 11 | ∆% | ∆% at constant exchange rates |
January-Sep. 10 |
| Net interest income | 9,676 | (5.0) | (3.0) | 10,182 |
| Net fees and commissions | 3,424 | 0.7 | 2.5 | 3,402 |
| Net trading income | 1,063 | (35.3) | (34.0) | 1,642 |
| Dividend income | 332 | 10.2 | 10.7 | 302 |
| Income by the equity method | 394 | 86.6 | 86.6 | 211 |
| Other operating income and expense | 163 | (27.5) | (32.3) | 225 |
| Gross income | 15,052 | (5.7) | (4.0) | 15,964 |
| Operating costs | (7,299) | 9.9 | 12.3 | (6,642) |
| Personnel expenses | (3,907) | 9.3 | 11.5 | (3,575) |
| General and administrative expenses | (2,771) | 10.6 | 13.2 | (2,506) |
| Depreciation and amortization | (620) | 10.4 | 13.6 | (562) |
| Operating income | 7,753 | (16.8) | (15.6) | 9,322 |
| Impairment on financial assets (net) | (2,890) | (19.9) | (18.4) | (3,606) |
| Provisions (net) | (328) | (19.7) | (19.2) | (408) |
| Other gains (losses) | (391) | n.s. | n.s. | (47) |
| Income before tax | 4,145 | (21.2) | (20.1) | 5,260 |
| Income tax | (652) | (49.8) | (49.0) | (1,300) |
| Net income | 3,492 | (11.8) | (10.6) | 3,960 |
| Non-controlling interests | (349) | 19.3 | 24.5 | (293) |
| Net attributable profit | 3,143 | (14.3) | (13.3) | 3,668 |
| Basic earnings per share (euros) | 0.66 | (26.9) | n.s. | 0.90 |
