South America
| Income statement (Million euros) |
|
|
|
|
|
|
|
|
|
|
|
|
|
|
|---|---|---|---|---|---|---|---|---|---|---|---|---|---|---|
|
|
|
|
Units: | |||||||||||
|
|
South America |
|
Banking business |
|
Pensions and Insurance | |||||||||
|
|
Ene.-Sep. 11 | ∆% | ∆% (1) | Ene.-Sep. 10 |
|
Ene.-Sep. 11 | ∆% | ∆% (1) | Ene.-Sep. 10 |
|
Ene.-Sep. 11 | ∆% | ∆% (1) | Ene.-Sep. 10 |
| Net interest income | 2,255 | 22.4 | 28.4 | 1,843 |
|
2,211 | 22.1 | 28.1 | 1,811 |
|
45 | 29.4 | 32.6 | 35 |
| Net fees and commissions | 780 | 10.0 | 13.4 | 709 |
|
561 | 11.2 | 16.8 | 505 |
|
222 | 3.3 | 2.0 | 215 |
| Net trading income | 355 | (11.8) | (7.0) | 402 |
|
335 | 9.2 | 15.4 | 306 |
|
21 | (78.1) | (77.2) | 96 |
| Other income/expenses | (176) | 25.5 | 39.2 | (141) |
|
(288) | 24.6 | 35.7 | (231) |
|
120 | 22.8 | 29.5 | 97 |
| Gross income | 3,214 | 14.2 | 19.0 | 2,814 |
|
2,818 | 17.9 | 23.4 | 2,391 |
|
408 | (8.1) | (6.5) | 443 |
| Operating costs | (1,463) | 20.5 | 26.1 | (1,215) |
|
(1,261) | 20.7 | 26.9 | (1,044) |
|
(179) | 3.0 | 6.1 | (173) |
| Personnel expenses | (747) | 19.3 | 24.7 | (626) |
|
(640) | 19.6 | 25.5 | (535) |
|
(87) | (0.5) | 2.4 | (88) |
| General and administrative expenses | (604) | 22.9 | 28.8 | (491) |
|
(514) | 23.0 | 29.4 | (417) |
|
(86) | 7.2 | 10.5 | (80) |
| Depreciation and amortization | (113) | 15.6 | 21.6 | (98) |
|
(107) | 16.6 | 23.0 | (92) |
|
(6) | (0.7) | 0.6 | (6) |
| Operating income | 1,751 | 9.5 | 13.7 | 1,599 |
|
1,558 | 15.6 | 20.7 | 1,347 |
|
229 | (15.2) | (14.5) | 270 |
| Impairment on financial assets (net) | (322) | 7.0 | 11.2 | (301) |
|
(322) | 7.0 | 11.2 | (301) |
|
- | - | - | - |
| Provisions (net) and other gains (losses) | (44) | 105.5 | 114.3 | (21) |
|
(47) | 211.0 | 225.8 | (15) |
|
3 | n.s. | n.s. | (6) |
| Income before tax | 1,385 | 8.5 | 12.6 | 1,277 |
|
1,188 | 15.3 | 20.5 | 1,030 |
|
226 | (14.2) | (13.6) | 264 |
| Income tax | (282) | (0.1) | 5.1 | (282) |
|
(246) | 14.0 | 20.6 | (215) |
|
(47) | (25.0) | (23.1) | (63) |
| Net income | 1,103 | 10.9 | 14.7 | 994 |
|
943 | 15.7 | 20.5 | 815 |
|
179 | (10.9) | (10.7) | 201 |
| Non-controlling interests | (349) | 18.0 | 23.0 | (296) |
|
(308) | 26.8 | 33.7 | (242) |
|
(42) | (21.9) | (22.4) | (53) |
| Net attributable profit | 754 | 7.9 | 11.2 | 698 |
|
635 | 11.0 | 15.0 | 573 |
|
137 | (6.8) | (6.4) | 148 |
(1) At constant exchange rate
| Balance sheet (Million euros) |
|
|
|
|
|
|
|
|
|
|
|
|
|
|
|---|---|---|---|---|---|---|---|---|---|---|---|---|---|---|
|
|
|
|
Units: | |||||||||||
|
|
South America |
|
Banking business |
|
Pensions and Insurance | |||||||||
|
|
30-09-11 | ∆% | ∆% (1) | 30-09-10 |
|
30-09-11 | ∆% | ∆% (1) | 30-09-10 |
|
30-09-11 | ∆% | ∆% (1) | 30-09-10 |
| Cash and balances with central banks | 7,833 | 44.3 | 44.9 | 5,429 |
|
7,833 | 44.3 | 44.9 | 5,429 |
|
- | - | - | - |
| Financial assets | 9,891 | 13.2 | 15.7 | 8,736 |
|
8,441 | 18.3 | (0.6) | 7,136 |
|
1,396 | (13.1) | 7.8 | 1,605 |
| Loans and receivables | 38,853 | 24.7 | 26.8 | 31,152 |
|
38,238 | 25.1 | 27.2 | 30,563 |
|
404 | (42.8) | (40.6) | 706 |
| Loans and advances to customers | 35,135 | 28.6 | 30.8 | 27,324 |
|
35,062 | 29.1 | 31.3 | 27,159 |
|
85 | (51.1) | (49.3) | 174 |
| Loans and advances to credit institutions and other | 3,718 | (2.9) | (1.6) | 3,828 |
|
3,176 | (6.7) | (5.7) | 3,405 |
|
319 | (40.1) | (37.7) | 532 |
| Tangible assets | 728 | 14.9 | 16.5 | 634 |
|
677 | 17.0 | 18.3 | 578 |
|
51 | (7.3) | (3.2) | 55 |
| Other assets | 2,403 | 14.6 | 17.4 | 2,097 |
|
2,008 | 13.3 | 16.5 | 1,773 |
|
152 | (14.2) | (11.0) | 177 |
| Total assets/Liabilities and equity | 59,707 | 24.3 | 26.4 | 48,048 |
|
57,196 | 25.8 | 27.7 | 45,480 |
|
2,033 | (21.3) | (18.1) | 2,544 |
| Deposits from central banks and credit institutions | 5,623 | 30.3 | 33.2 | 4,314 |
|
5,622 | 30.5 | 33.3 | 4,309 |
|
5 | 7.2 | 8.7 | 5 |
| Deposits from customers | 38,866 | 28.9 | 30.5 | 30,145 |
|
38,983 | 28.8 | 30.4 | 30,255 |
|
- | - | - | - |
| Debt certificates | 2,144 | 0.2 | 3.4 | 2,139 |
|
2,144 | 0.2 | 3.4 | 2,139 |
|
- | - | - | - |
| Subordinated liabilities | 1,451 | 14.1 | 17.0 | 1,272 |
|
1,088 | 10.2 | 13.9 | 987 |
|
- | - | - | - |
| Inter-area positions | 1,373 | 50.9 | 57.8 | 910 |
|
1,373 | 50.9 | 57.8 | 910 |
|
- | - | - | - |
| Financial liabilities held for trading | 7,582 | 10.0 | 12.4 | 6,893 |
|
5,616 | 13.6 | 15.2 | 4,944 |
|
1,708 | (18.6) | (15.4) | 2,100 |
| Other liabilities | 2,668 | 12.4 | 15.1 | 2,374 |
|
2,370 | 22.5 | 24.8 | 1,935 |
|
290 | (34.1) | (31.4) | 440 |
(1) At constant exchange rate.
The South American area manages the BBVA Group’s banking, pension and insurance businesses in the region. The first half of 2011 saw the incorporation of Crédit Uruguay (purchased at the end of 2010 and merged with BBVA Uruguay in May 2011) and the sale of the Group’s holding in the insurance company Consolidar Retiro of Argentina. An additional 24.5% holding in the company Forum Chile was also purchased in September 2011.
Economic growth continues very strong in South America, sustained by domestic demand and also the support from what is still a lax fiscal policy. Growth rates in the consumption of durable goods and bank lending in most countries are very high. Employment figures also continue to be very positive and are providing significant support for domestic demand. Commodity prices remain high, which explains the buoyancy of income.
With respect to the main currencies in the region, the final exchange rates of the Argentinean, Chilean and Colombian peso have fallen over the last 12 months and, except in the case of Argentina, over the quarter. In contrast, the Peruvian nuevo sol and Venezuelan bolivar gained over the year, and particularly over the quarter. The overall impact on business activity and the balance sheet in the area is slightly negative compared with the figures for the same date last year. In terms of average exchange rates, all the currencies except the Chilean peso lost in year-on-year terms, so the effect on the income statement is also negative and more significant than in the balance sheet and business activity figures. Unless otherwise indicated, all comments below refer to changes at constant exchange rates.
South America highlights in the third quarter
- Positive activity in all the geographical areas.
- New gains in market share highly focused on the individual segment.
- Strong revenues.
- Improvement in risk indicators.
The persistent positive economic climate continues to favor growth in activity in the region. The loan book in the area at the end of September amounted to €36,403m, a year-on-year increase of 30.7% and a gain of 29 basis points in market share over the last 12 months (August figures, the latest available). The figures for customer funds are also very positive, particularly in the case of lower-cost funds such as current and savings accounts, which grew by 31.0% over the 12 months.
| Significant ratios (Percentage) |
|
|
|
|---|---|---|---|
|
|
South America | ||
|
|
30-09-11 | 30-06-11 | 30-09-10 |
| Efficiency ratio | 45.5 | 44.5 | 43.2 |
| NPA ratio | 2.3 | 2.4 | 2.4 |
| NPA coverage ratio | 140 | 138 | 139 |
| Risk premium | 1.31 | 1.33 | 1.51 |
| South America. Operating income (Million euros at constant exchange rate)  |
South America. Net attributable profit (Million euros at constant exchange rate)  |
|---|
Including the assets under management in mutual funds, customer funds managed by the banks amounted to €43,926m as of 30-Sep-2011, 25.4% up on the same date in 2010. In the pension business, the high level of volatility in the financial markets has impacted the profitability of the managed portfolios, and led growth of the assets under management to slow over the last twelve months to only 1.9%, amounting to €44,708 as of 30-Sep-2011.
This level of growth in business activity has been reflected in the net interest income in the area, which totaled €2,255m year to date (30-Sep-2011), 28.4% up on the same period last year. There was also growth of 13.4% year-on-year in net fees and commissions to €780m. NTI, at €355m, was influenced strongly by the value of US dollar positions in Banco Provincial and by the turmoil on the markets. As a result of the above, combined with the other income/expenses item, the gross income year to date was €3,214m, 19.0% up on the same period last year.
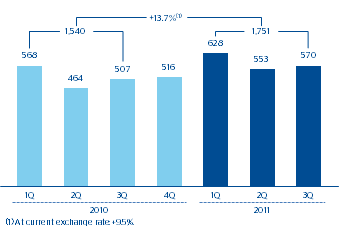
Expenses in the area were up 26.1% to €1,463m, due to the expansion and positioning projects undertaken by most of the units. However, thanks to the positive revenue figures, the efficiency ratio remains at a reasonable level of 45.5%. The operating income to September was €1,751m, up 13.7%.
It is of particular note that the major growth in business activity has been accompanied by maintenance of asset quality. This is reflected in the reduction in the NPA ratio, which as of 30-Sep-2011 stood at 2.3% (2.4% as of 30-Jun-2011). Impairment losses on financial assets were up 11.2% to €322m as a result of increased lending activity, while the coverage ratio has improved over the quarter by more than 2 percentage points to 140%.
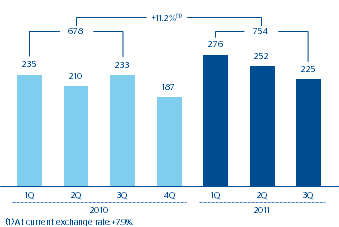
To sum up, there has been a significant growth in activity reflected in the boost provided by revenues. This, together with the performance of expenses and loan-loss provisions have led to a growth of 11.2% in the net attributable profit to €754m in the nine months ended 30-Sep-2011.
