
| Income statement (Million euros) |
|||||||||
|---|---|---|---|---|---|---|---|---|---|
|
|
|
|
Units: | ||||||
|
|
The United States |
|
BBVA Compass | ||||||
|
|
Jan.-Sep. 11 | ∆% | ∆% (1) | Jan.-Sep. 10 |
|
Jan.-Sep. 11 | ∆% | ∆% (1) | Jan.-Sep. 10 |
| Net interest income | 1,182 | (14.6) | (9.1) | 1,384 |
|
1,044 | (21.3) | (7.6) | 1,209 |
| Net fees and commissions | 480 | (3.7) | 2.3 | 498 |
|
396 | (5.4) | 0.6 | 421 |
| Net trading income | 109 | (5.7) | (0.8) | 116 |
|
72 | (1.7) | 5.0 | 74 |
| Other income/expenses | (60) | 71.9 | 84.0 | (35) |
|
(58) | 79.2 | 101.2 | (31) |
| Gross income | 1,711 | (12.8) | (7.3) | 1,963 |
|
1,454 | (11.8) | (7.0) | 1,672 |
| Operating costs | (1,097) | (3.3) | 3.1 | (1,135) |
|
(960) | (5.0) | 1.0 | (1,017) |
| Personnel expenses | (599) | 5.2 | 12.1 | (570) |
|
(525) | 3.2 | 10.8 | (507) |
| General and administrative expenses | (372) | (10.3) | (4.4) | (415) |
|
(313) | (12.7) | (8.1) | (364) |
| Depreciation and amortization | (126) | (16.2) | (10.4) | (151) |
|
(122) | (14.8) | (10.6) | (146) |
| Operating income | 613 | (25.9) | (21.5) | 828 |
|
494 | (22.2) | (19.4) | 655 |
| Impairment on financial assets (net) | (285) | (42.9) | (38.8) | (498) |
|
(273) | (36.1) | (36.0) | (456) |
| Provisions (net) and other gains (losses) | (23) | 7.3 | 14.9 | (22) |
|
(5) | (70.2) | (76.4) | (21) |
| Income before tax | 305 | (0.8) | 3.2 | 308 |
|
216 | 19.4 | 30.1 | 178 |
| Income tax | (88) | 3.7 | 7.7 | (84) |
|
(57) | 24.6 | 36.3 | (45) |
| Net income | 218 | (2.5) | 1.5 | 223 |
|
159 | 17.6 | 28.0 | 133 |
| Non-controlling interests | - | - | - | - |
|
- | - | - | - |
| Net attributable profit | 218 | (2.5) | 1.5 | 223 |
|
159 | 17.6 | 28.0 | 133 |
(1) At constant exchange rate.
| Balance sheet (Million euros) |
|||||||||
|---|---|---|---|---|---|---|---|---|---|
|
|
|
|
Units: | ||||||
|
|
The United States |
|
BBVA Compass | ||||||
|
|
30-09-11 | ∆% | ∆% (1) | 30-09-10 |
|
30-09-11 | ∆% | ∆% (1) | 30-09-10 |
| Cash and balances with central banks | 2,124 | (26.5) | (27.3) | 2,890 |
|
1,778 | (2.1) | (3.3) | 1,819 |
| Financial assets | 8,054 | 8.9 | 7.7 | 7,396 |
|
7,196 | 8.7 | 10.9 | 6,561 |
| Loans and receivables | 38,841 | (2.3) | (3.4) | 39,762 |
|
31,445 | 1.8 | 0.9 | 30,836 |
| Loans and advances to customers | 37,331 | (2.6) | (3.6) | 38,317 |
|
30,588 | 1.6 | 0.7 | 30,064 |
| Loans and advances to credit institutions and other | 1,510 | 4.5 | 3.4 | 1,445 |
|
857 | 9.9 | 9.8 | 772 |
| Inter-area positions | 27 | (99.8) | (99.8) | 11,990 |
|
2 | (88.5) | (98.3) | 127 |
| Tangible assets | 782 | (3.0) | (4.0) | 806 |
|
746 | (2.7) | (4.0) | 768 |
| Other assets | 2,259 | (8.8) | (9.8) | 2,476 |
|
2,024 | (8.6) | (10.5) | 2,237 |
| Total assets/Liabilities and equity | 52,086 | (20.3) | (21.1) | 65,320 |
|
43,190 | 1.8 | 0.9 | 42,349 |
| Deposits from central banks and credit institutions | 7,436 | 29.2 | 27.8 | 5,756 |
|
4,265 | 17.8 | 18.5 | 3,562 |
| Deposits from customers | 36,220 | (28.8) | (29.6) | 50,892 |
|
32,411 | (0.0) | (1.1) | 32,422 |
| Debt certificates | 348 | (29.0) | (29.8) | 490 |
|
- | - | - | - |
| Subordinated liabilities | 1,156 | (1.7) | (2.8) | 1,176 |
|
932 | 2.7 | 1.9 | 905 |
| Inter-area positions | - | - | - | - |
|
- | - | - | - |
| Financial liabilities held for trading | 439 | 24.3 | 22.9 | 353 |
|
424 | 27.2 | 28.8 | 326 |
| Other liabilities | 3,516 | (1.5) | (2.6) | 3,571 |
|
2,703 | (0.1) | (1.2) | 2,707 |
| Economic capital allocated | 2,972 | (3.5) | (4.6) | 3,081 |
|
2,455 | 1.0 | 0.1 | 2,427 |
(1) At constant exchange rate.
This area encompasses the Group’s business in the United States and in the Commonwealth of Puerto Rico. BBVA Compass accounts for around 83% of the assets and 85% of the earnings generated in the country. Most of the comments below are therefore focused on this bank.
In the third quarter of 2011, the country’s economic growth slowed, although the chance of a return to recession is still low and an upturn in the economy is expected over the second half of the year. However, the sluggish recovery in employment and wages, a residential construction sector still deep in the process of adjustment, the continued household deleveraging process, and the volatility of financial markets may all continue to hold the recovery in check.
With respect to the labor market, the latest available figures place the unemployment rate at 9.1%, with layoffs in the public sector and the weakness of the real estate market being the factors that contribute most to the rise. Labor market growth is expected to remain low, in line with a slower than expected economic recovery.
A combination of a weak economic activity and stable commodity prices are helping contain inflationary pressures. Deflationary risks have also declined, with the latest consumer price index higher than expected.
The FED is explicitly committed to keeping interest rates low through mid-2013 and recently announced that it plans to lengthen the average maturity of its balance sheet by selling USD 400 billion of shorter-term Treasury holdings and purchasing the same amount of longer-term securities. Moreover, it could implement further stimulus measures if downside growth risks increase.
The United States highlights in the third quarter
- The favorable new production figures for target portfolios have offset falling loans to the developer sector.
- The positive trend in the customer spread continues.
- New improvements in asset quality.
- BBVA Compass has the best net interest income/ATA ratio within its peer group.
The exchange rate of the US currency against the euro has gained year-on-year (1.1%), and in particular quarter-on-quarter (7.0%), so the impact of the currency on the balance sheet and volume of business in the area is positive. However, in terms of average exchange rates the dollar is down 6.5% over the last 12 months, though practically unchanged on the figure for the previous quarter. Thus the effect of the year-on-year changes in the income statement is negative and practically nil between June and September 2011. Unless otherwise noted, the figures referred to below are given at constant exchange rates.
| Significant ratios (Percentage) |
|
|
|
|---|---|---|---|
|
|
The United States | ||
|
|
30-09-11 | 30-06-11 | 30-09-10 |
| Efficiency ratio | 64.2 | 63.2 | 57.8 |
| NPA ratio | 3.9 | 4.2 | 4.6 |
| NPA coverage ratio | 69 | 67 | 58 |
| Risk premium | 1.04 | 1.16 | 1.58 |
| The United States. Operating income (Million euros at constant exchange rate) 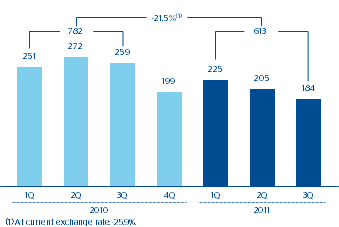 |
The United States. Net attributable profit (Million euros at constant exchange rate) 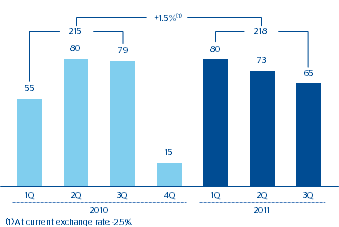 |
|---|
Over the first nine months of the year, this area generated a net attributable profit of €218m, a year-on-year increase of 1.5%. The most important part of the income statement continues to be risk containment. This is reflected in the figures for impairment losses on financial assets, which were down over the year by 38.8%. This has in turn had a positive impact on the risk premium in the area, which was 1.04% at the close of September (1.16% as of 30-Jun-2011). It is also worth highlighting that these favourable figures for loan-loss provisioning are not having a negative impact on coverage in the United States, which increased by over two percentage points over the quarter to 69%. The NPA ratio also improved, closing on 30-Sep-2011 at 3.9% (4.2% as of 30-Jun-2011).
In terms of business activity, the area is continuing with its process of altering the loan-book mix. In the third quarter of 2011, the favorable new production figures for target lending portfolios have offset falling loans to the developer sector. This explains the quarter-on-quarter growth of 1.6% in gross lending to customers in the area to €38,456m as of 30-Sep-2011. Customer funds stood at €35,335m as of 30-Sep-2011, with the focus still on those with lower costs.