Mexico
| Income statement (Million euros) |
|
|
|
|
|
|
|
|
|
|
|
|
|
|
|---|---|---|---|---|---|---|---|---|---|---|---|---|---|---|
|
|
|
|
Units: | |||||||||||
|
|
Mexico |
|
Banking Business |
|
Pensions and Insurance | |||||||||
|
|
Jan.-Sep. 11 | ∆% | ∆% (1) | Jan.-Sep.10 |
|
Jan.-Sep.11 | ∆% | ∆% (1) | Jan.-Sep. 10 |
|
Jan.-Sep.11 | ∆% | ∆% (1) | Jan.-Sep. 10 |
| Net interest income | 2,874 | 4.6 | 6.0 | 2,748 |
|
2,814 | 4.5 | 5.9 | 2,693 |
|
54 | 6.6 | 8.0 | 51 |
| Net fees and commissions | 906 | (0.8) | 0.5 | 913 |
|
848 | (1.4) | (0.1) | 860 |
|
53 | 3.7 | 5.1 | 51 |
| Net trading income | 264 | (20.4) | (19.4) | 331 |
|
204 | (10.6) | (9.4) | 228 |
|
60 | (42.2) | (41.4) | 104 |
| Other income/expenses | 164 | 23.3 | 24.9 | 133 |
|
(85) | (25.4) | (24.4) | (114) |
|
296 | 16.1 | 17.7 | 255 |
| Gross income | 4,208 | 2.0 | 3.3 | 4,126 |
|
3,780 | 3.1 | 4.5 | 3,666 |
|
463 | 0.6 | 1.9 | 460 |
| Operating costs | (1,522) | 8.1 | 9.5 | (1,408) |
|
(1,431) | 10.4 | 11.8 | (1,297) |
|
(121) | 8.3 | 9.7 | (112) |
| Personnel expenses | (663) | 2.6 | 4.0 | (646) |
|
(607) | 2.5 | 3.8 | (592) |
|
(56) | 5.0 | 6.4 | (53) |
| General and administrative expenses | (781) | 11.5 | 13.0 | (700) |
|
(748) | 16.1 | 17.6 | (644) |
|
(63) | 11.6 | 13.0 | (57) |
| Depreciation and amortization | (78) | 26.1 | 27.7 | (62) |
|
(76) | 27.0 | 28.6 | (60) |
|
(2) | (0.0) | 1.3 | (2) |
| Operating income | 2,686 | (1.2) | 0.1 | 2,717 |
|
2,349 | (0.9) | 0.4 | 2,369 |
|
342 | (1.9) | (0.6) | 349 |
| Impairment on financial assets (net) | (915) | (4.1) | (2.8) | (953) |
|
(915) | (4.1) | (2.8) | (953) |
|
- | - | - | - |
| Provisions (net) and other gains (losses) | (50) | 2.9 | 4.2 | (48) |
|
(47) | (2.5) | (1.3) | (49) |
|
(3) | n.s. | n.s. | 1 |
| Income before tax | 1,722 | 0.3 | 1.7 | 1,716 |
|
1,387 | 1.4 | 2.8 | 1,367 |
|
340 | (2.8) | (1.5) | 349 |
| Income tax | (445) | (2.9) | (1.6) | (458) |
|
(345) | (3.0) | (1.7) | (356) |
|
(100) | (1.4) | (0.1) | (101) |
| Net income | 1,277 | 1.5 | 2.9 | 1,257 |
|
1,041 | 3.0 | 4.3 | 1,011 |
|
240 | (3.3) | (2.1) | 248 |
| Non-controlling interests | (2) | (34.7) | (33.8) | (3) |
|
- | - | - | - |
|
(2) | (5.9) | (4.7) | (2) |
| Net attributable profit | 1,275 | 1.6 | 2.9 | 1,254 |
|
1,041 | 3.0 | 4.4 | 1,011 |
|
238 | (3.3) | (2.0) | 246 |
(1) At constant exchange rate.
| Balance sheet (Million euros) |
|
|
|
|
|
|
|
|
|
|
|
|
|
|
|---|---|---|---|---|---|---|---|---|---|---|---|---|---|---|
|
|
|
|
Units: | |||||||||||
|
|
Mexico |
|
Banking Business |
|
Pensions and Insurance | |||||||||
|
|
30-09-11 | ∆% | ∆% (1) | 30-09-10 |
|
30-09-11 | ∆% | ∆% (1) | 30-09-10 |
|
30-09-11 | ∆% | ∆% (1) | 30-09-10 |
| Cash and balances with central banks | 5,771 | 1.4 | 10.0 | 5,693 |
|
5,771 | 1.4 | 10.0 | 5,693 |
|
- | - | - | - |
| Financial assets | 24,682 | (3.0) | 5.3 | 25,440 |
|
20,055 | (3.4) | 4.9 | 20,757 |
|
4,860 | (1.7) | 5.3 | 4,944 |
| Loans and receivables | 35,024 | (7.7) | 0.3 | 37,927 |
|
34,721 | (7.9) | 0.0 | 37,686 |
|
352 | 24.9 | 35.6 | 281 |
| Loans and advances to customers | 32,242 | (0.7) | 7.8 | 32,458 |
|
32,090 | (0.7) | 7.8 | 32,325 |
|
182 | 16.4 | 26.4 | 157 |
| Loans and advances to credit institutions and other | 2,782 | (49.1) | (44.8) | 5,469 |
|
2,631 | (50.9) | (46.7) | 5,361 |
|
169 | 35.5 | 47.1 | 125 |
| Tangible assets | 901 | 9.7 | 19.1 | 821 |
|
895 | 9.9 | 19.3 | 814 |
|
6 | (7.6) | 0.4 | 7 |
| Other assets | 1,654 | 2.8 | 11.6 | 1,610 |
|
2,700 | 23.2 | 33.7 | 2,193 |
|
111 | (11.4) | (3.8) | 125 |
| Total assets/Liabilities and equity | 68,032 | (4.8) | 3.3 | 71,492 |
|
64,142 | (4.5) | 3.7 | 67,143 |
|
5,329 | (0.5) | 8.0 | 5,358 |
| Deposits from central banks and credit institutions | 9,788 | (19.3) | (12.4) | 12,128 |
|
9,788 | (19.3) | (12.4) | 12,128 |
|
- | - | - | - |
| Deposits from customers | 31,703 | (4.4) | 3.8 | 33,157 |
|
31,722 | (4.4) | 3.8 | 33,175 |
|
- | - | - | - |
| Debt certificates | 3,887 | (5.9) | 2.1 | 4,132 |
|
3,887 | (5.9) | 2.1 | 4,132 |
|
- | - | - | - |
| Subordinated liabilities | 2,244 | 24.6 | 35.3 | 1,800 |
|
3,373 | 35.0 | 46.6 | 2,497 |
|
- | - | - | - |
| Inter-area positions | 6,153 | 0.7 | 9.3 | 6,110 |
|
6,153 | 0.7 | 9.3 | 6,110 |
|
- | - | - | - |
| Financial liabilities held for trading | 10,376 | (3.8) | 4.5 | 10,783 |
|
5,735 | (4.3) | 3.9 | 5,995 |
|
4,972 | (3.0) | 5.3 | 5,127 |
| Other liabilities | 3,883 | 14.8 | 24.7 | 3,381 |
|
3,485 | 12.3 | 21.9 | 3,104 |
|
352 | 52.6 | 65.7 | 231 |
(1) At constant exchange rate.
This area comprises the banking, pensions and insurance business conducted in Mexico by the BBVA Bancomer Financial Group (hereinafter, BBVA Bancomer).
Despite the slowdown in advanced economies, emerging economies still continue to grow solidly towards more sustainable levels. In Mexico, the most important indicators (industrial activity, formal employment, retail sales) remain positive, so the growth rate could have continued in the third quarter at levels that are similar to those of the previous quarter. Inflation is not a concern, given the domestic environment of contained demand, which limits the power of the transfer of costs from companies to consumers. Against this backdrop, with inflation in Banxico’s target range, the Central Bank could analyze interest rate lowering scenarios. The overnight rate could also be maintained at similar levels to current ones beyond 2012 if the global economic scenario were to deteriorate.
As regards to the exchange rate, the Mexican peso/euro rate has depreciated both in year-on-year terms (down 7.9%) and in quarter-on-quarter terms (down 8.7%). Thus the impact of the currency on the balance sheet and business volume in the area is negative. The average exchange rate also declined, though in this case to a lesser extent (down 1.3% year-on-year and down 1.4% quarter-on-quarter). Thus the effect of the currency on the income statement was slightly negative. Unless otherwise indicated, all comments below refer to changes at a constant exchange rate.
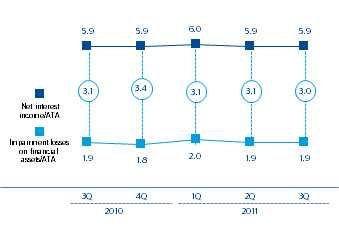
In the third quarter of 2011, Mexico continued to present positive growth in recurring revenues. Therefore, between January and September 2011, the net interest income grew 6.0% year-on-year rate, mainly boosted by increased lending and deposit gathering volumes and by positive price management. This has enabled to offset the effects of the low interest rate situation and the lower contribution to income by global businesses. These were affected, in part, by the convulsed situation of the financial markets that led to a loss of asset values and also to decreased activity. Nevertheless, from the point of view of profitability, measured over ATA, both the net interest income and impairment losses on financial assets demonstrated great stability in the past year. Fees and commissions remain at the same level as the previous year. The performance of asset management fees (investment companies and pension funds) was able to offset the less favorable evolution of banking fees, affected by regulatory changes. The aforementioned situation of the financial markets, especially in the last part of the quarter, has led to lower brokerage revenues. Thus, as of September 30, 2011, NTI stood at €264m. Insurance activity has maintained its positive trajectory, which explains why other income grew at a year-on-year rate of 24.9% Consequently, the accumulated gross income reached €4,208m, marking 3.3% year-on-year growth.Mexico highlights in the third quarter
- Strength of banking activity, especially in the retail portfolio.
- Stability in the risk premium.
- BBVA Bancomer, the most profitable entity in the sector.
- Good performance of pensions and insurance activity.
| Significant ratios (Percentage) |
|
|
|
|---|---|---|---|
|
|
Mexico | ||
|
|
30-09-11 | 30-06-11 | 30-09-10 |
| Efficiency ratio | 36.2 | 35.9 | 34.1 |
| NPA ratio | 3.5 | 3.4 | 3.4 |
| NPA coverage ratio | 128 | 134 | 150 |
| Risk premium | 3.39 | 3.38 | 3.86 |
| Mexico. Operating income (Million euros at constant exchange rate)  |
Mexico. Net attributable profit (Million euros at constant exchange rate)  |
|---|
BBVA Bancomer. Net interest income/Impairment losses on financial asset
(Percentage)

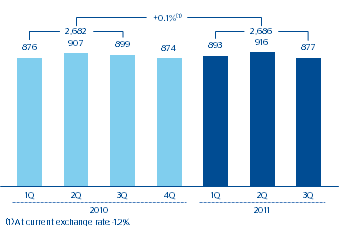
Operating expenses at €1,522m were up 9.5% with respect to the same period of 2010. Personnel costs grew at the rate of inflation, so the increase can be explained by the investment in infrastructure and banking expansion (banking penetration). In the last 12 months, the branch network grew by 14 branches, while the number of ATMs totaled 7,293 (735 more than one year prior). Consequently, BBVA Bancomer retains its leading position in the country by number of branches and ATMs with a market share of 15.8% and 20.4%, respectively, according to information from the Comisión Nacional Bancaria y de Valores (CNBV) in August 2011. As a result of these revenues and expenses, the accumulated operating income as of 30-Sep-2011 remained flat as compared to the same period last year and stood at €2,686m.
Lending growth has been accompanied by proper risk management. This has enabled the impairment losses on financial assets to remain at practically the same levels as in the previous year and the accumulated risk premium to improve by 47 basis points (standing at 3.39%) in the last twelve months. Furthermore, the NPA and coverage ratios closed the month of September at 3.5% and 128% respectively.
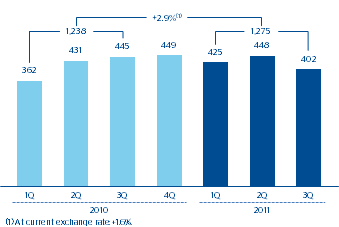
As of September 30, 2011, the net attributable profit stood at €1,275m. BBVA Bancomer is the entity with the highest profitability, as it achieved an ROE of 20.2% (according to local accounting criteria) and surpassed the average of its main competitors by 6 percentage points.
