Report 2Q 2026
BBVA Posts Over €6 Billion in Profit for the First Half of 2026 (Up 11 Percent) and Announces a New €2 Billion Extraordinary Share Buyback Program
The share
The global economy has remained resilient during the second quarter of 2026, despite the high levels of uncertainty and the prolongation of the conflict between the United States and Iran for longer than initially expected. According to BBVA Research, global GDP will grow by 3.1% for the full year, just one tenth below what was anticipated in the previous quarter, thanks to the support provided by the increase in investment in artificial intelligence, the increase in defense spending and the expansionary nature of fiscal policies.
The relatively strong performance of the U.S. economy and the strength of China in the face of the energy shock linked to tensions in Iran largely explain the resilience of global growth. In particular, the GDP growth forecast for the United States in 2026 stands at 2.4%, one tenth lower than in the previous scenario, with investment in technology driving domestic spending, while it remains unchanged for China, at 4.5%, where the dynamism of the external sector is limiting the effects of the adjustment in the real estate market. However, in the Eurozone, the impact of higher energy commodity prices on its economy is expected to be greater, which justifies the downward revision of BBVA Research's growth forecast for this year from 1.1% to 0.7%.
For its part, the price increases of energy-intensive goods and the supply chain disruptions associated with the conflict in the Middle East have raised inflation in the main geographical areas and are expected to keep it above the levels anticipated a quarter ago for the remainder of the year: in the case of the United States, the headline rate could stand around 3.5%, and in the Eurozone, above 2.5%. Given this price context, monetary policy will become more restrictive. BBVA Research anticipates that the Fed will leave benchmark interest rates unchanged at 3.75%, compared to the two cuts expected in the previous scenario, and the ECB will keep them at 2.25% following the hike carried out in June. In China, monetary conditions will also be somewhat less accommodative and rates could remain at 2025 levels.
The balance of risks for the global economy has improved following the restoration of trade flows in the Strait of Hormuz and the correction in oil prices, although uncertainty remains high regarding the definite resolution of the crisis between the United States, Iran and Israel. Added to this are the protectionist measures in trade and immigration, and the structural challenges facing Europe and China. Geopolitical tensions in several Middle Eastern countries, the possible revival of the threat of potential actions by the United States administration in Greenland or Mexico, and uncertainty regarding the reaction of central banks and their impact on financial markets also constitute sources of risk. On a positive note, it is worth mentioning the boost in investment in artificial intelligence and its medium-term effect on the productivity of economies that promote its adoption.
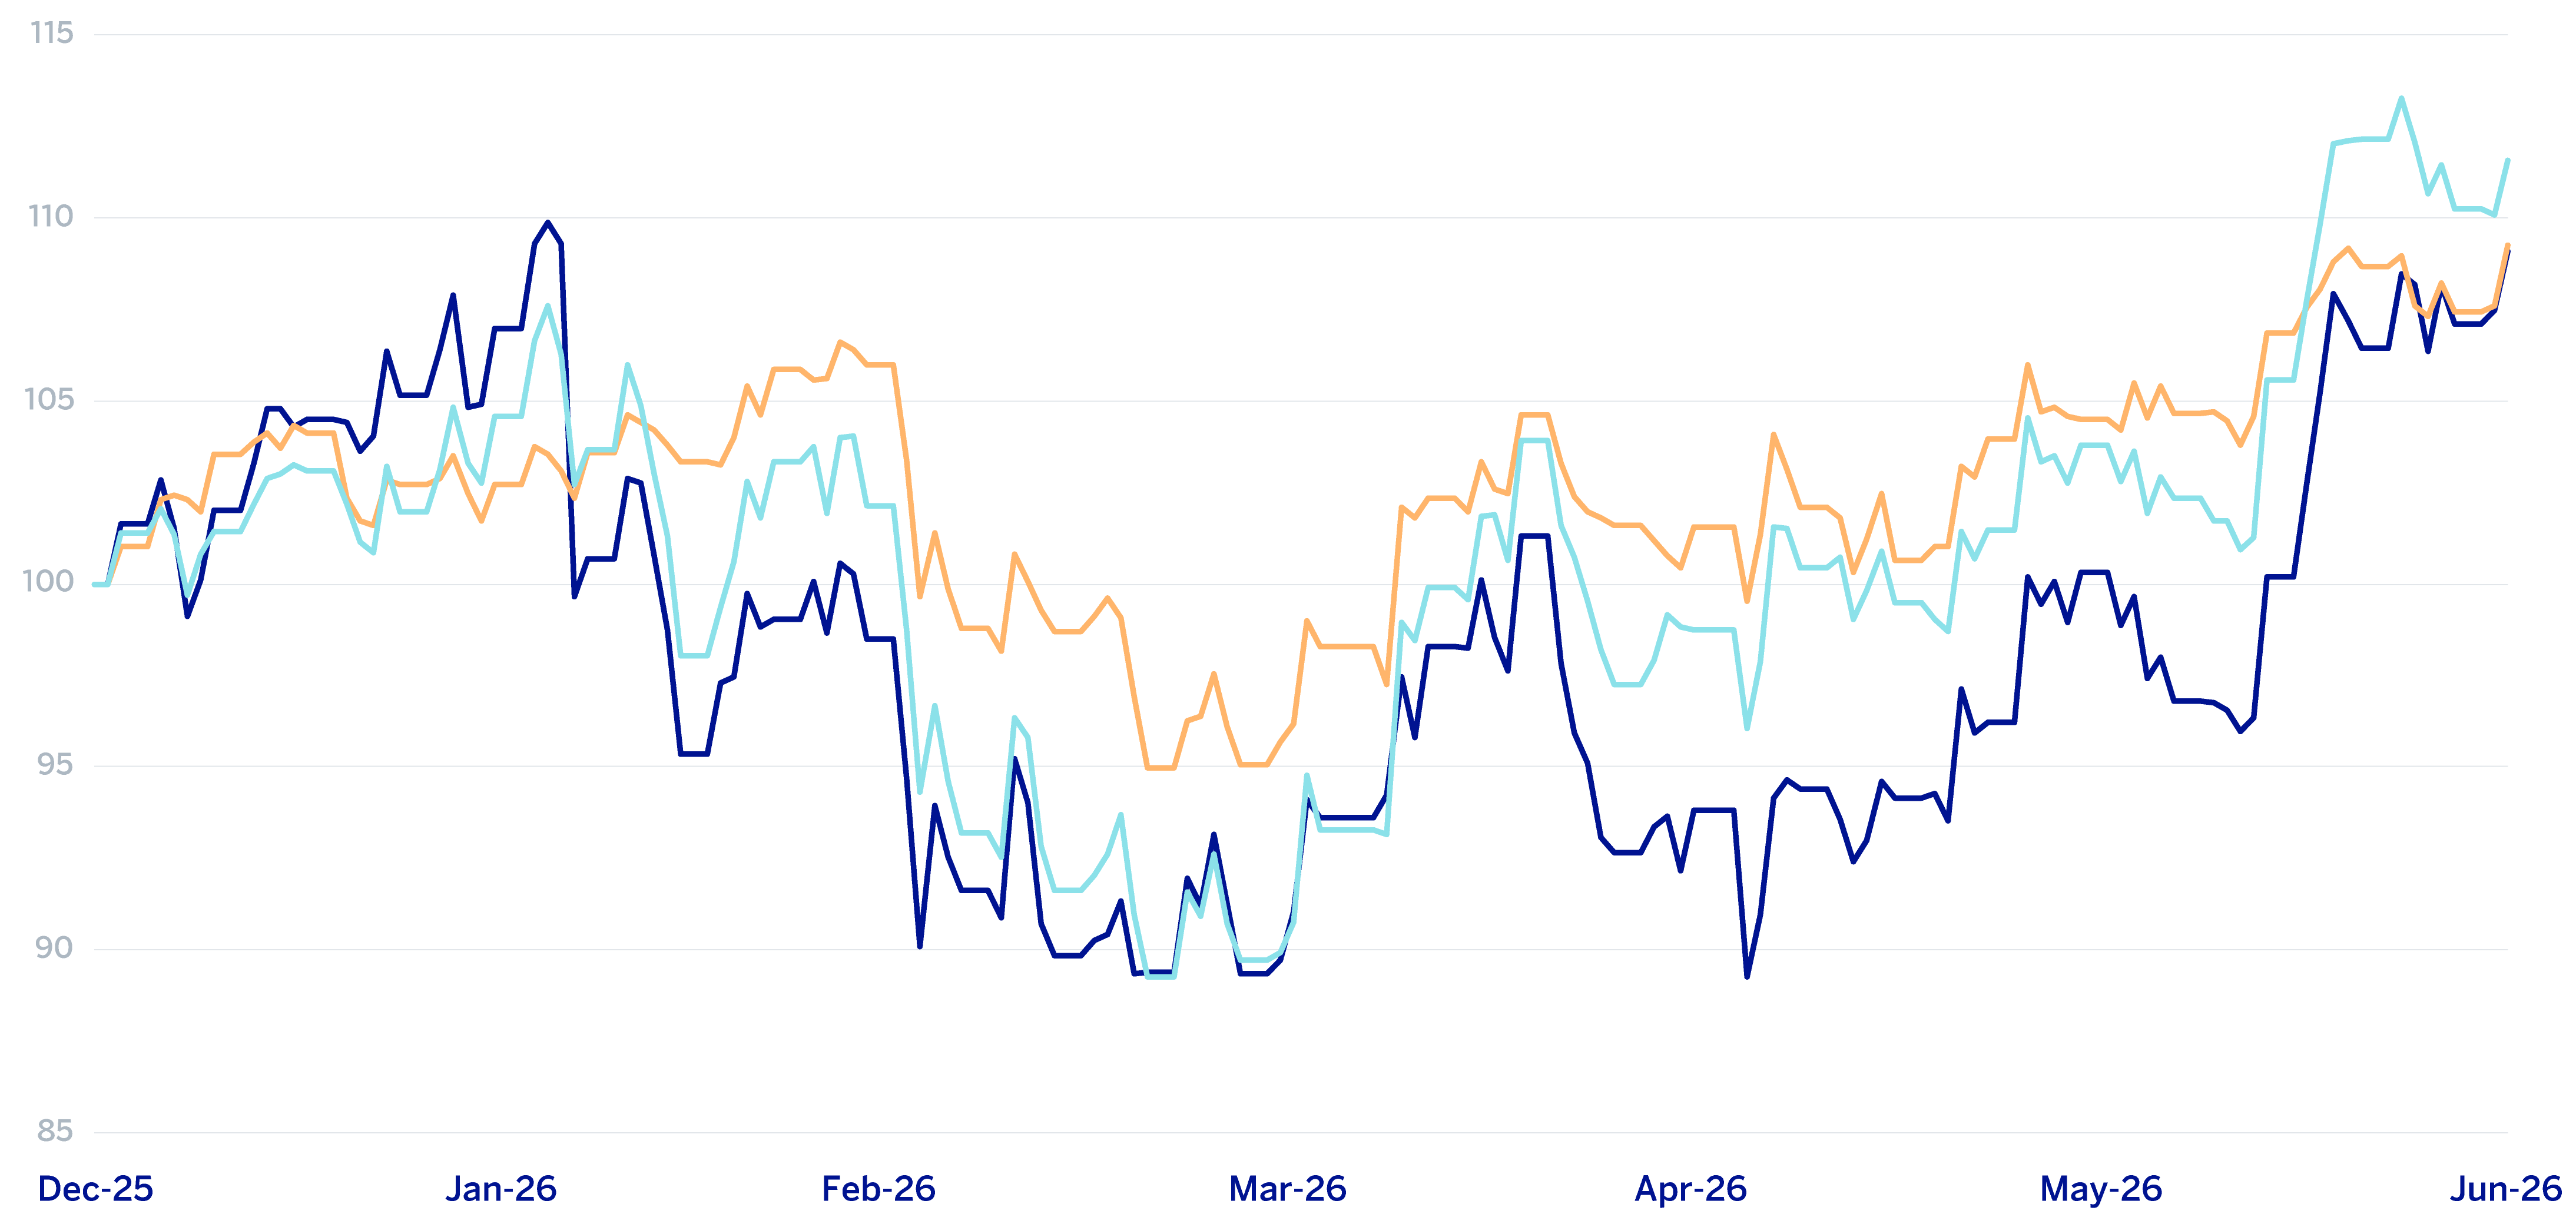
The main indexes have shown a positive performance during the second quarter of 2026. In Europe, the Stoxx Europe 600 index rose by 10.0% compared to the end of March 2026, and in Spain the Ibex 35 increased by 14.2% in the same period, showing a better relative performance. In the United States, the S&P 500 index increased by 14.9%.
With regard to the banking sector indexes, the performance in the second quarter of 2026 was better than the general indexes in Europe. The Stoxx Europe 600 Banks index, which includes the banks in the United Kingdom, and the Euro Stoxx Banks, an index of Eurozone banks, increased by 21.1% and 22.9% respectively, while in the United States, the S&P Regional Banks sector index increased by 15.0% in the period.
BBVA’s share price increased by 19.8% during the quarter, outperforming its sector index, closing the month of June 2026 at €21.87.
BBVA share evolution
Compared with European indexes (base indice 100=31-12-25)
BBVA
Eurostoxx-50
Eurostoxx Banks
| THE BBVA SHARE AND SHARE PERFORMANCE RATIOS | ||
|---|---|---|
| 30/06/2026 | 31/03/2026 | |
| Number of shareholders | 655,706 | 660,942 |
| Number of shares issued (millions) | 5,581 | 5,634 |
| Closing price (euros) | 21.87 | 18.25 |
| Book value per share (euros) (1) | 10.71 | 10.10 |
| Tangible book value per share (euros) (1) | 10.14 | 9.57 |
| Market capitalization (millions of euros) | 122,061 | 102,821 |
| (1) For more information, see Alternative Performance Measures at the end of the quarterly report. | ||
The shareholder remuneration policy contemplates that cash distributions may be combined with share buybacks, all subject to the authorization and approvals applicable at any given time1.
Regarding cash distribution, the Annual General Shareholders´ Meeting of BBVA held on March 20, 2026, approved, under item 1.3 of the Agenda, a cash distribution against the 2025 results as a final dividend for the 2025 financial year, for an amount equal to €0.60 gross per outstanding BBVA share entitled to participate in this distribution, which was paid on April 10, 2026. Thus, the total amount of cash distributions for the 2025 financial year, taking into account that in November 2025 a gross amount of €0.32 per share was distributed, stood at €0.92 gross per share.
For its part, the 2026 share buyback programs include an extraordinary program of almost €4,000 million whose execution in several tranches started in December 2025 and is nearing completion in addition to a new extraordinary share buyback program of €2,000 million, which will be executed in several tranches, and whose first tranche, amounting to €1,000 million, is scheduled to begin execution on August 5.
On June 30, 2026, the number of BBVA shares outstanding was 5,581 million. The number of shareholders reached 655,706 and, by type of investor, 67.97% of the capital belonged to institutional investors and the remaining 32.03% was in the hands of retail shareholders.
BBVA shares are included on the main stock market indexes. At the closing of June 2026, the weighting of BBVA shares in the Ibex 35, Euro Stoxx 50 and the Stoxx Europe 600 index, were 12.7%, 2.9% and 0.95%, respectively. They are also included on several sector indexes, including Stoxx Europe 600 Banks, which includes the United Kingdom, with a weighting of 6.2% and the Euro Stoxx Banks index for the eurozone with a weighting of 10.2%. Moreover BBVA maintains a significant presence on a number of international sustainability indexes, such as, Dow Jones Sustainability Index (DJSI), FTSE4Good or MSCI ESG Indexes.
1 For further information, please refer to the "Share buyback programs" section in the "Capital and shareholders" chapter of the quarterly report.
Group's information
- 2025-2029 Strategic Plan
- Results
- Balance sheet and business activity
- Solvency
- Sustainability
In the first half of 2026, the BBVA Group has continued to make significant progress in the execution of its 2025-2029 Strategic Plan, which aims to establish a new axis of differentiation by radically incorporating the customer perspective, as well as driving and strengthening the Group's commitment to growth and value creation.
BBVA is firmly betting on artificial intelligence as a key driver for achieving these goals, amplify their impact, and thus continue to lead the transformation of the sector. To accelerate this evolution across the organization, the Bank has created the new AI Transformation unit , an initiative that reinforces its commitment to integrating artificial intelligence across the entire Organization.
STRATEGIC PRIORITIES
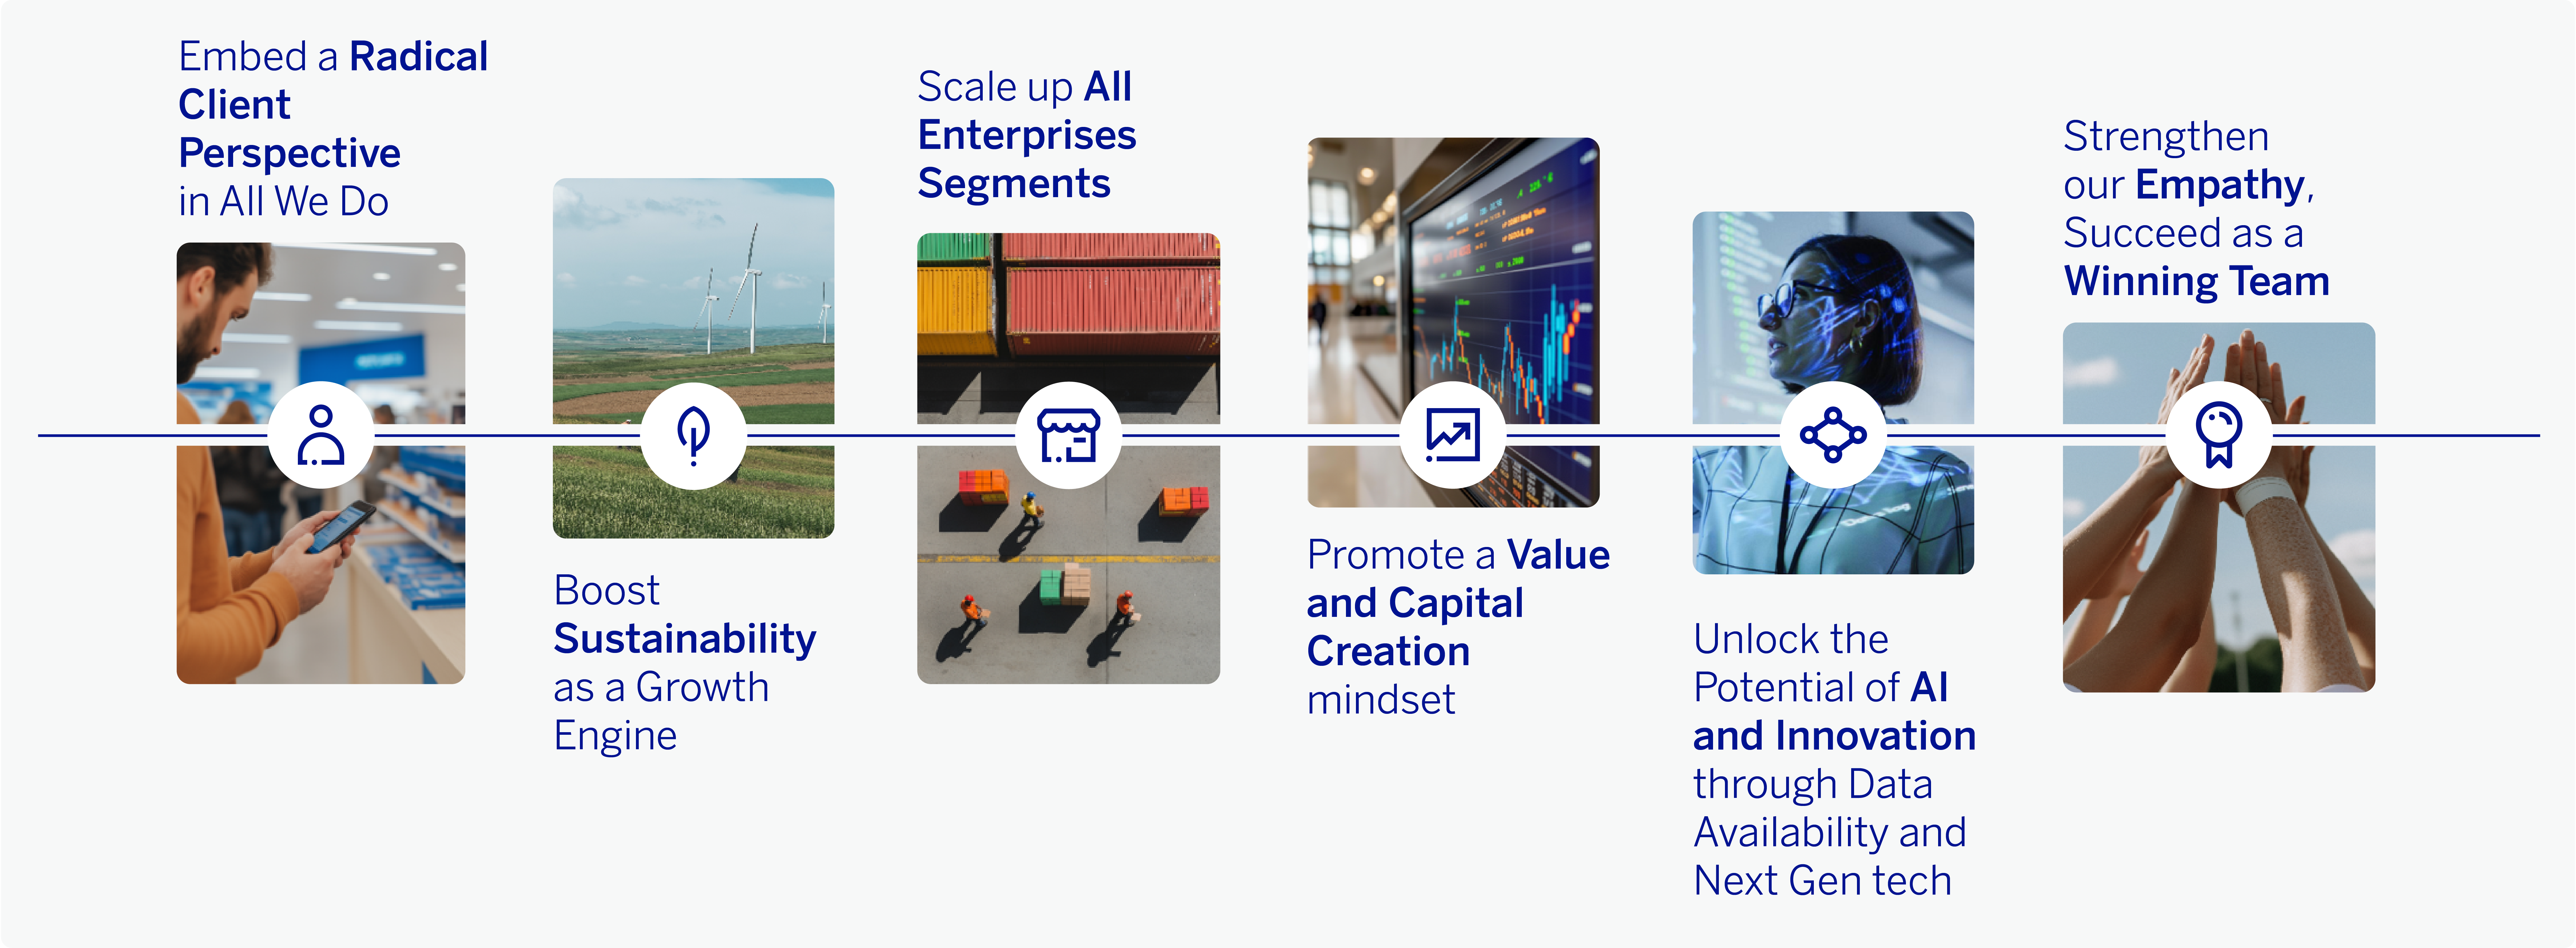
BBVA has established six Strategic Priorities to advance its strategy. These Priorities form the framework for implementing the 2025–2029 Strategic Plan.
Thanks to the strong execution of the Strategic Plan, BBVA continues to make progress in achieving the financial targets defined for the 2025-2028 period.
BBVA GROUP FINANCIAL KPIS GOALS EVOLUTION
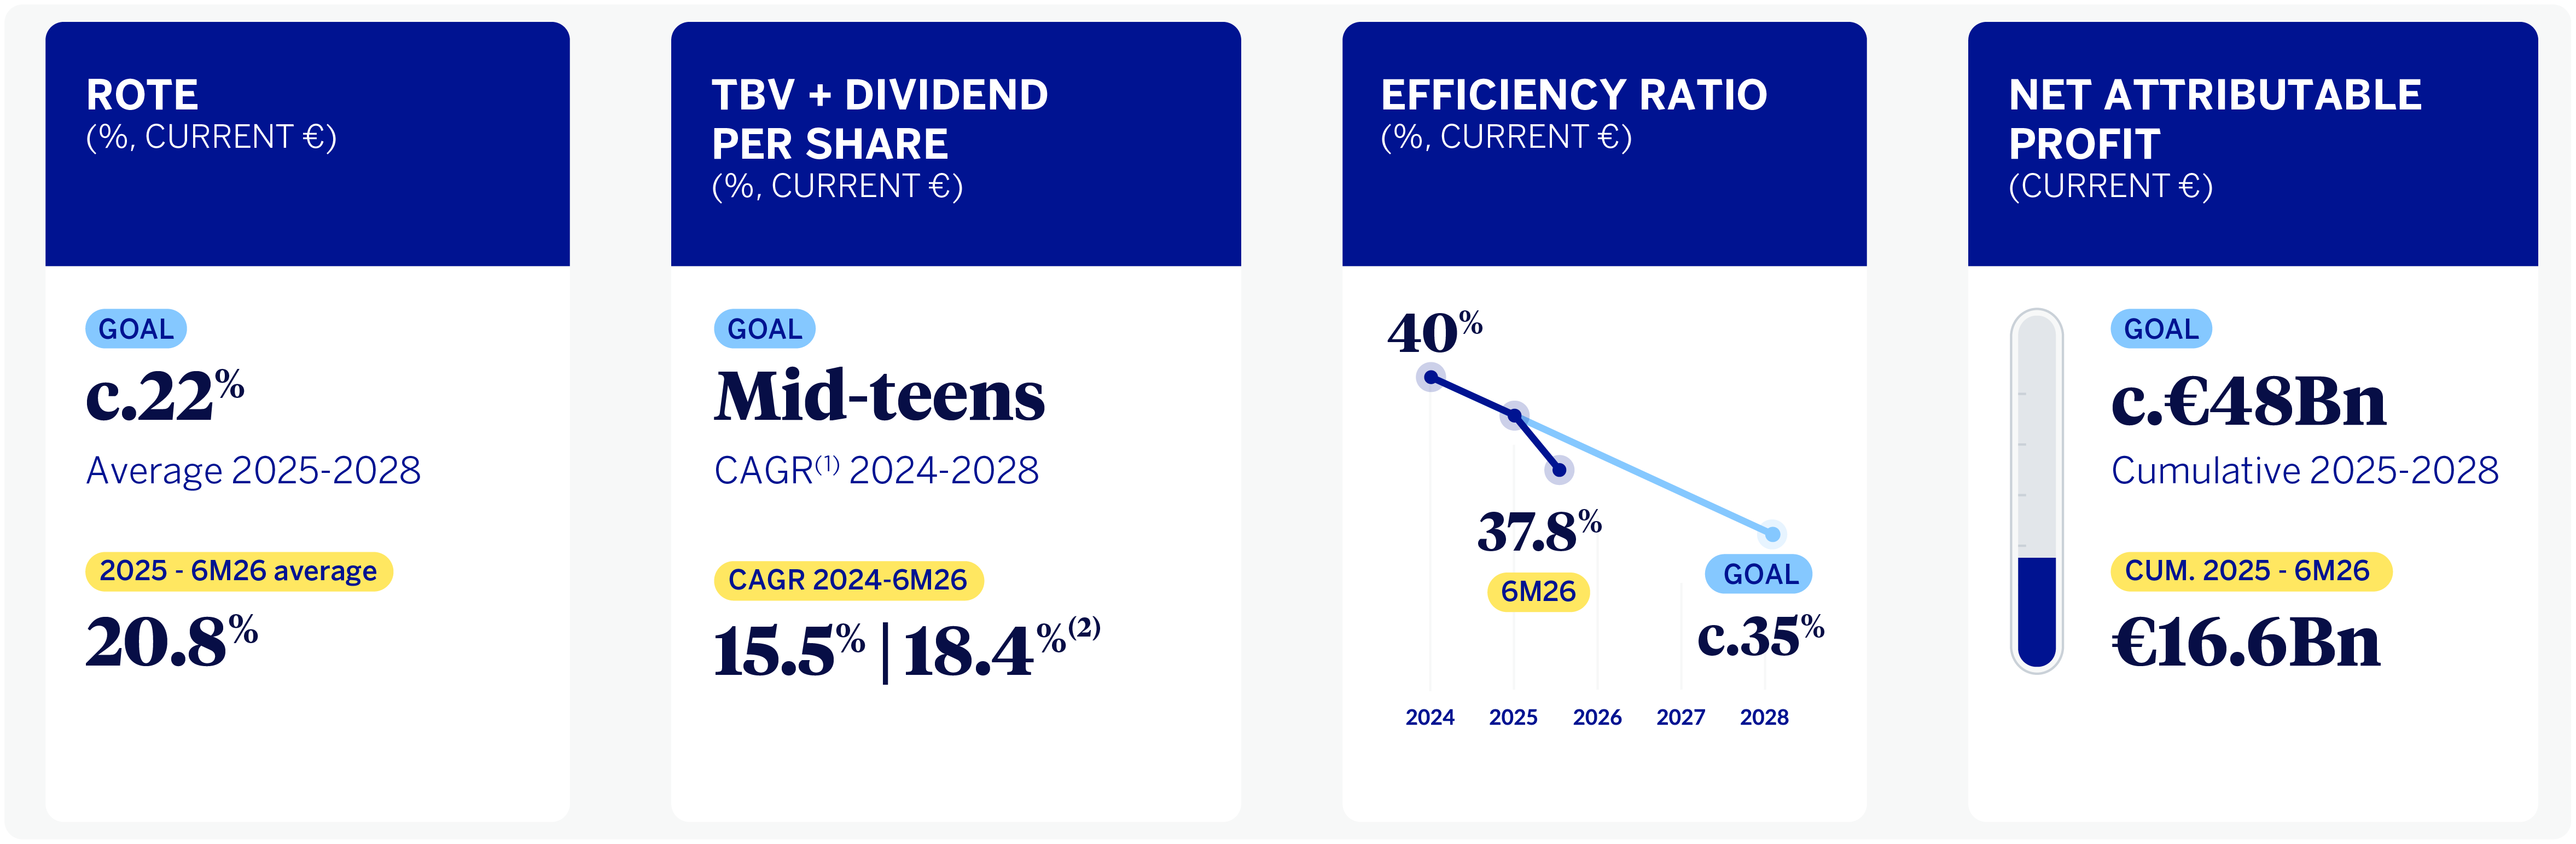
(1) Compound Annual Growth Rate.
(2) Excluding the effect of Share Buybacks.
 Read more
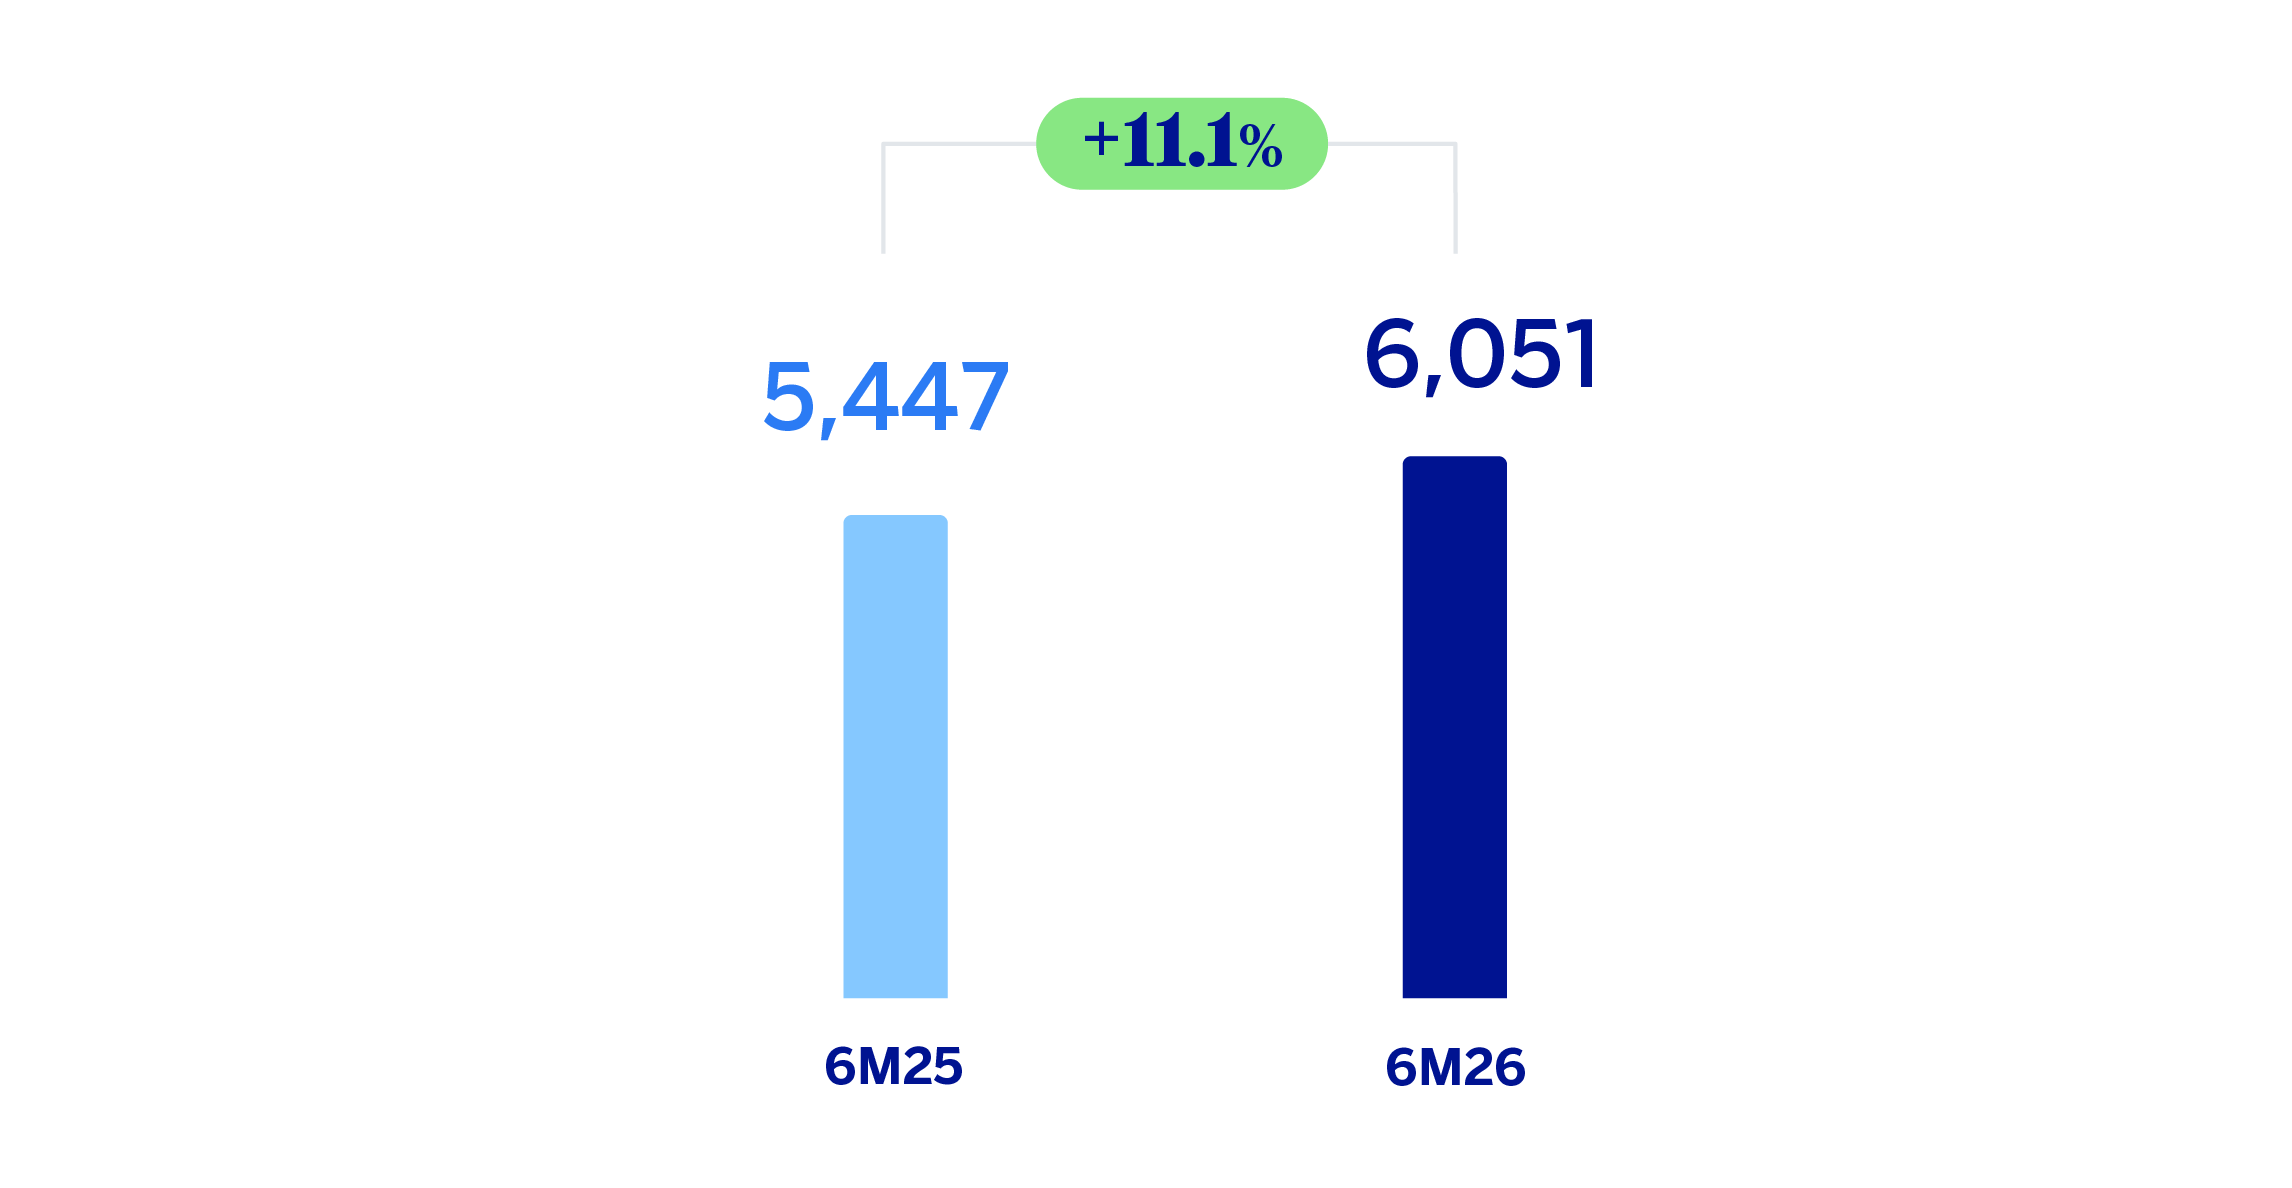
The BBVA Group achieved a cumulative result of €6,051 million at the end of the first half of 2026, representing an increase of 11.1% over the previous year, supported by the strong performance of recurring revenues from the banking business.
The profit for the first half has been mainly favored by the solid evolution of net interest income, which increased by 20.3%, with a positive performance in all business areas. This growth has been able to offset the higher operating expenses, which increased by 17.9%, and the provisions for impairment on financial assets, which grew by 26.6% compared to the accumulated balances as of June 30, 2025, in a context of loan growth. In addition, net fees and commissions, which together with net interest income make up the recurring revenues of the banking business, grew at a year-on-year rate of 14.0%.
NET ATTRIBUTABLE PROFIT (LOSS) (MILLIONS OF EUROS)
 Read more
Regarding activity, during the first half of 2026, loans and advances to customers increased by 10.6%, driven for another quarter by the dynamism of the wholesale segment. Within this, the increased volume of business loans stands out, growing by 13.0% at the Group level. Loans to individuals increased by 7.0%, with a favorable evolution across all products.
Customer funds registered an increase of 6.9% so far this year, with a growth of 6.1% in customer deposits, and of 8.7% in off-balance sheet funds at the Group level.
LOANS AND ADVANCES TO CUSTOMERS AND TOTAL CUSTOMER FUNDS (VARIATION COMPARED TO 31-12-2025)
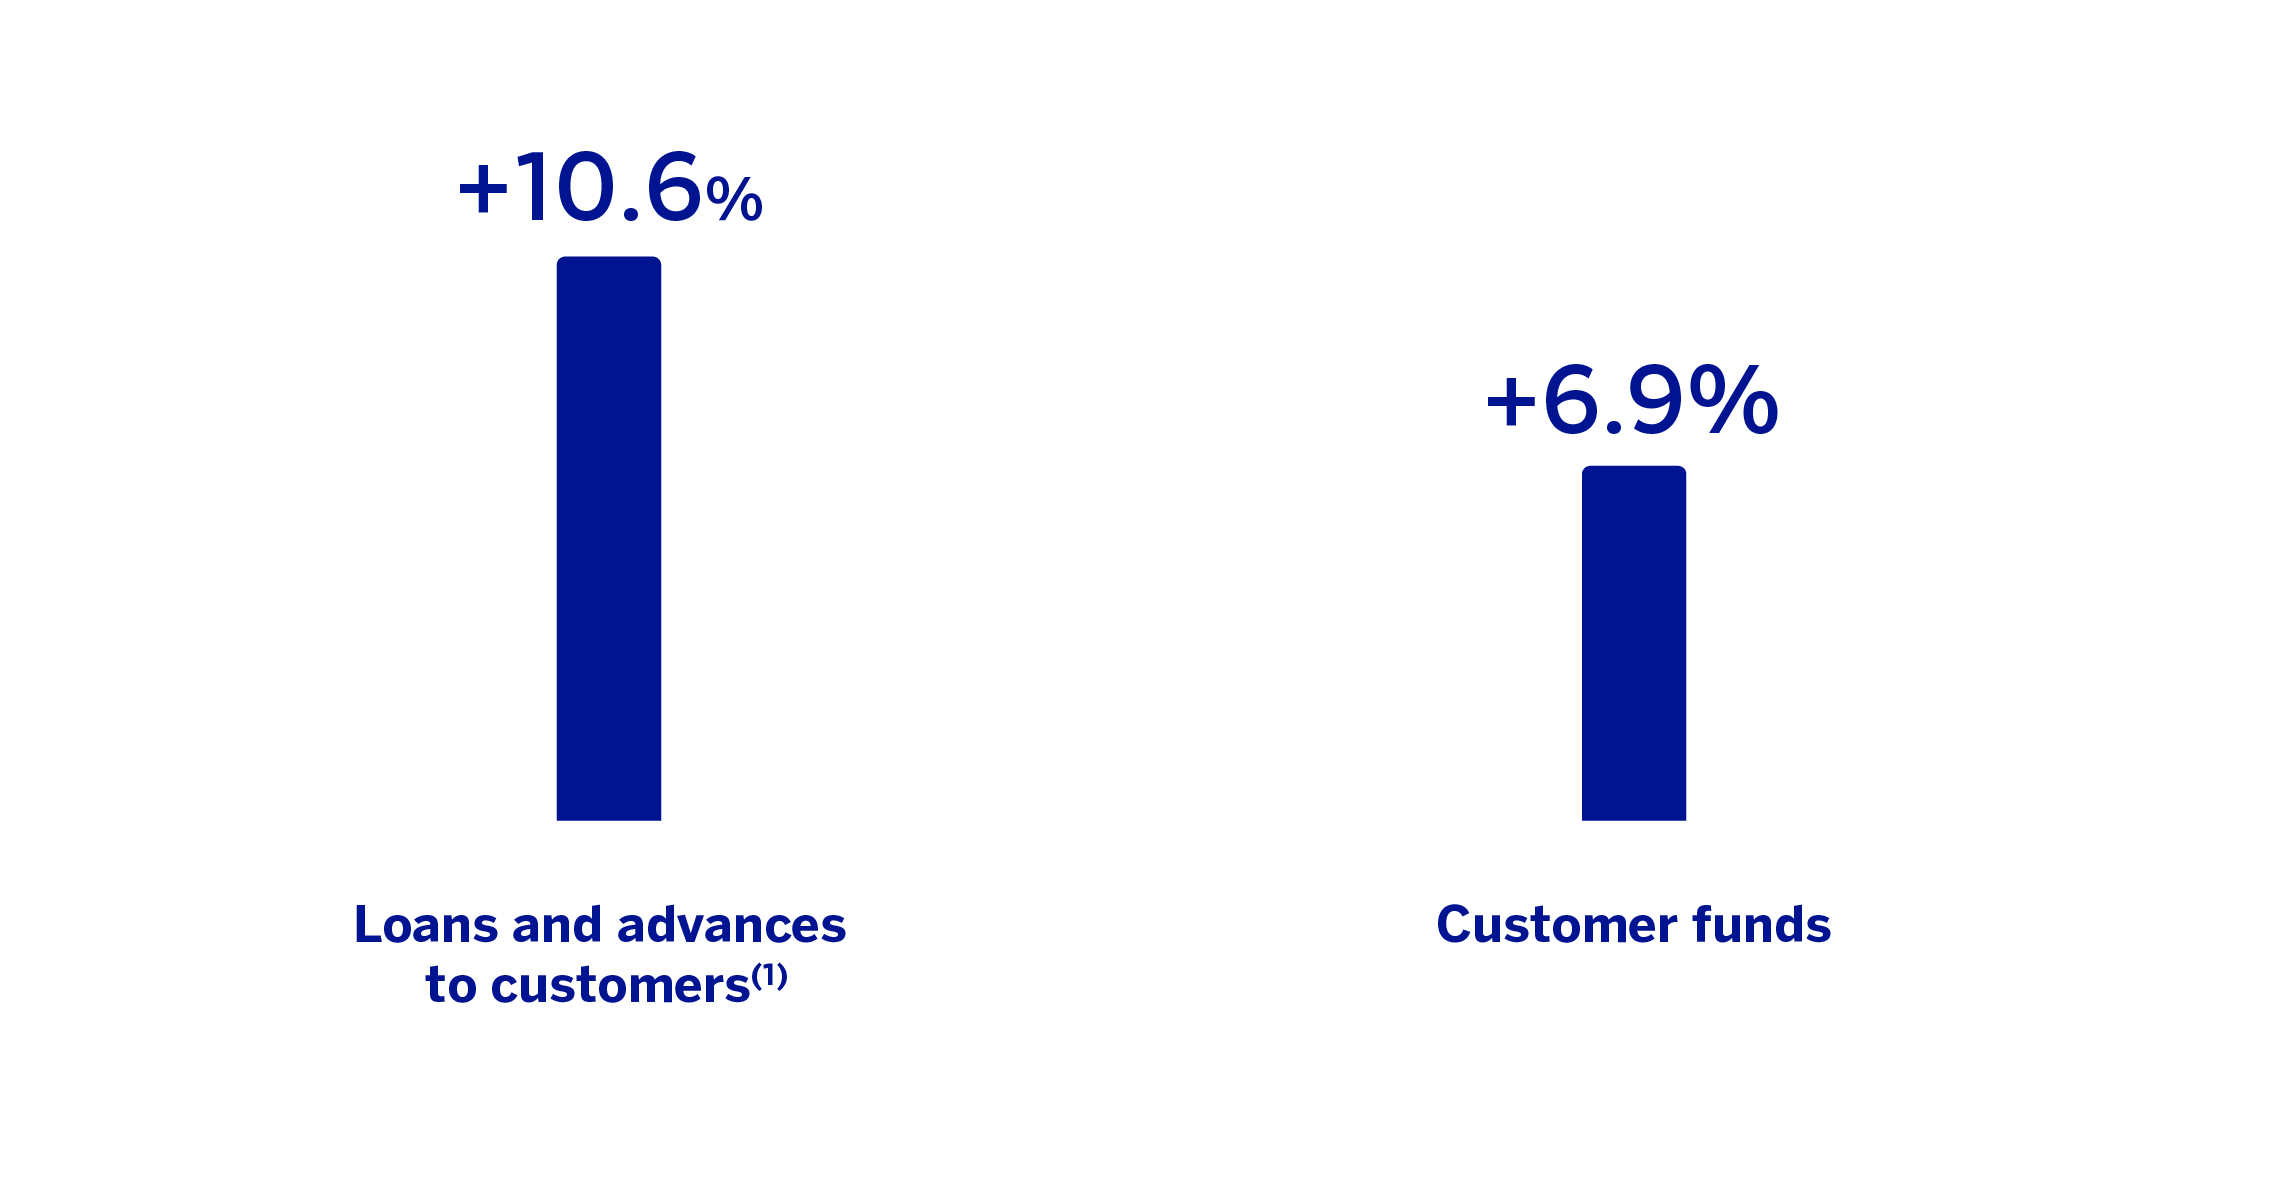
(1) The growth of performing loans and advances to customers under management (excluding repos) stands at 11.2%.
Read more
The BBVA Group's CET12 ratio stood at 12.90% as of June 30, 2026, which allows it to maintain a large management buffer over the Group's CET1 requirement as of that date (8.98%3), and is also above the Group's target management range of 11.5% - 12.0% of CET1.
CET1 RATIO
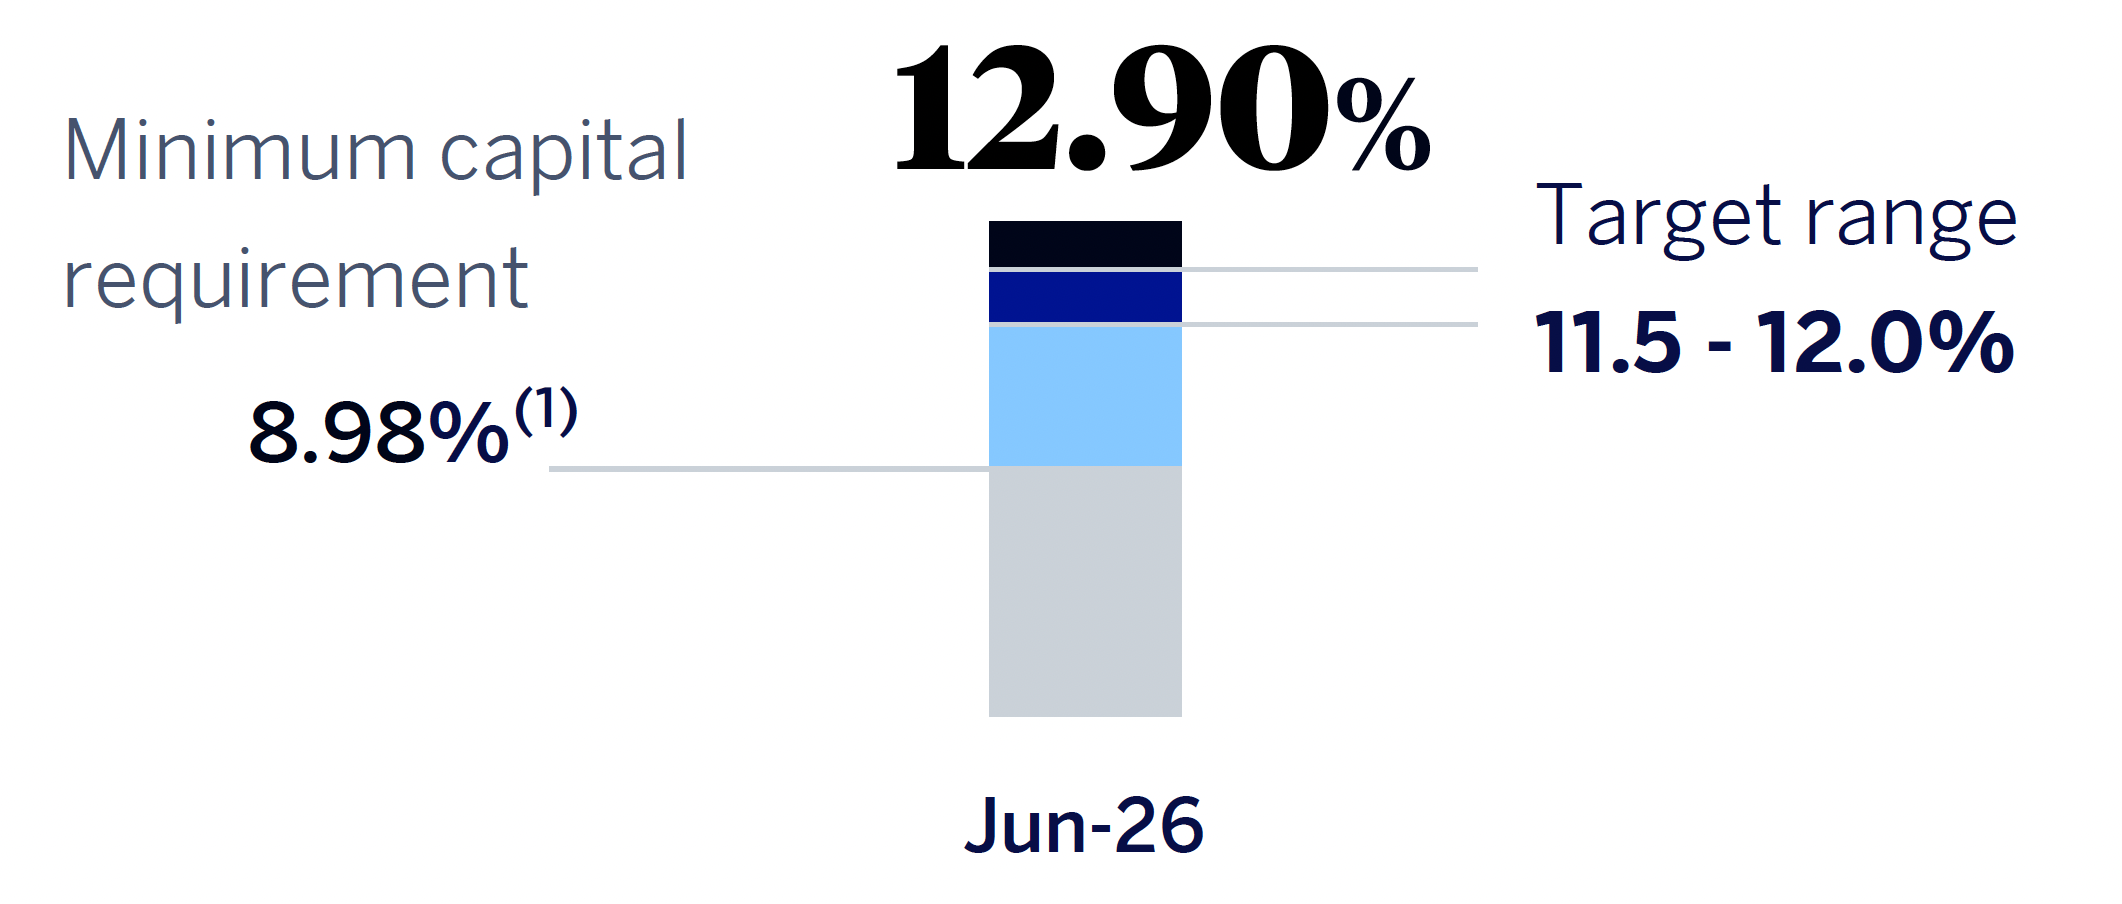
(1) Considering the latest official updates to the countercyclical capital buffer and the systemic risk buffer, applied on the basis of exposure as of March 31, 2026.
2 As of June 30, 2026, there were no differences between fully loaded and phased-in ratios given that the impact associated with the transitional adjustments is nil.
3 Considering the latest official updates to the countercyclical capital buffer and the systemic risk buffer, applied on the basis of exposure as of March 31, 2026.
Read more
BBVA is driving sustainability as a differential growth engine. Within the framework of its ambitious target of channeling €700 billion into sustainable business for the 2025–2029 period4, the BBVA Group has channeled approximately €82 billion in the first six months of 2026, bringing the cumulative total to €216 billion since the announcement of this new target.
SUSTAINABLE BUSINESS CHANNELING 2025–JUNE 2026

SUSTAINABLE BUSINESS CHANNELING 6M26
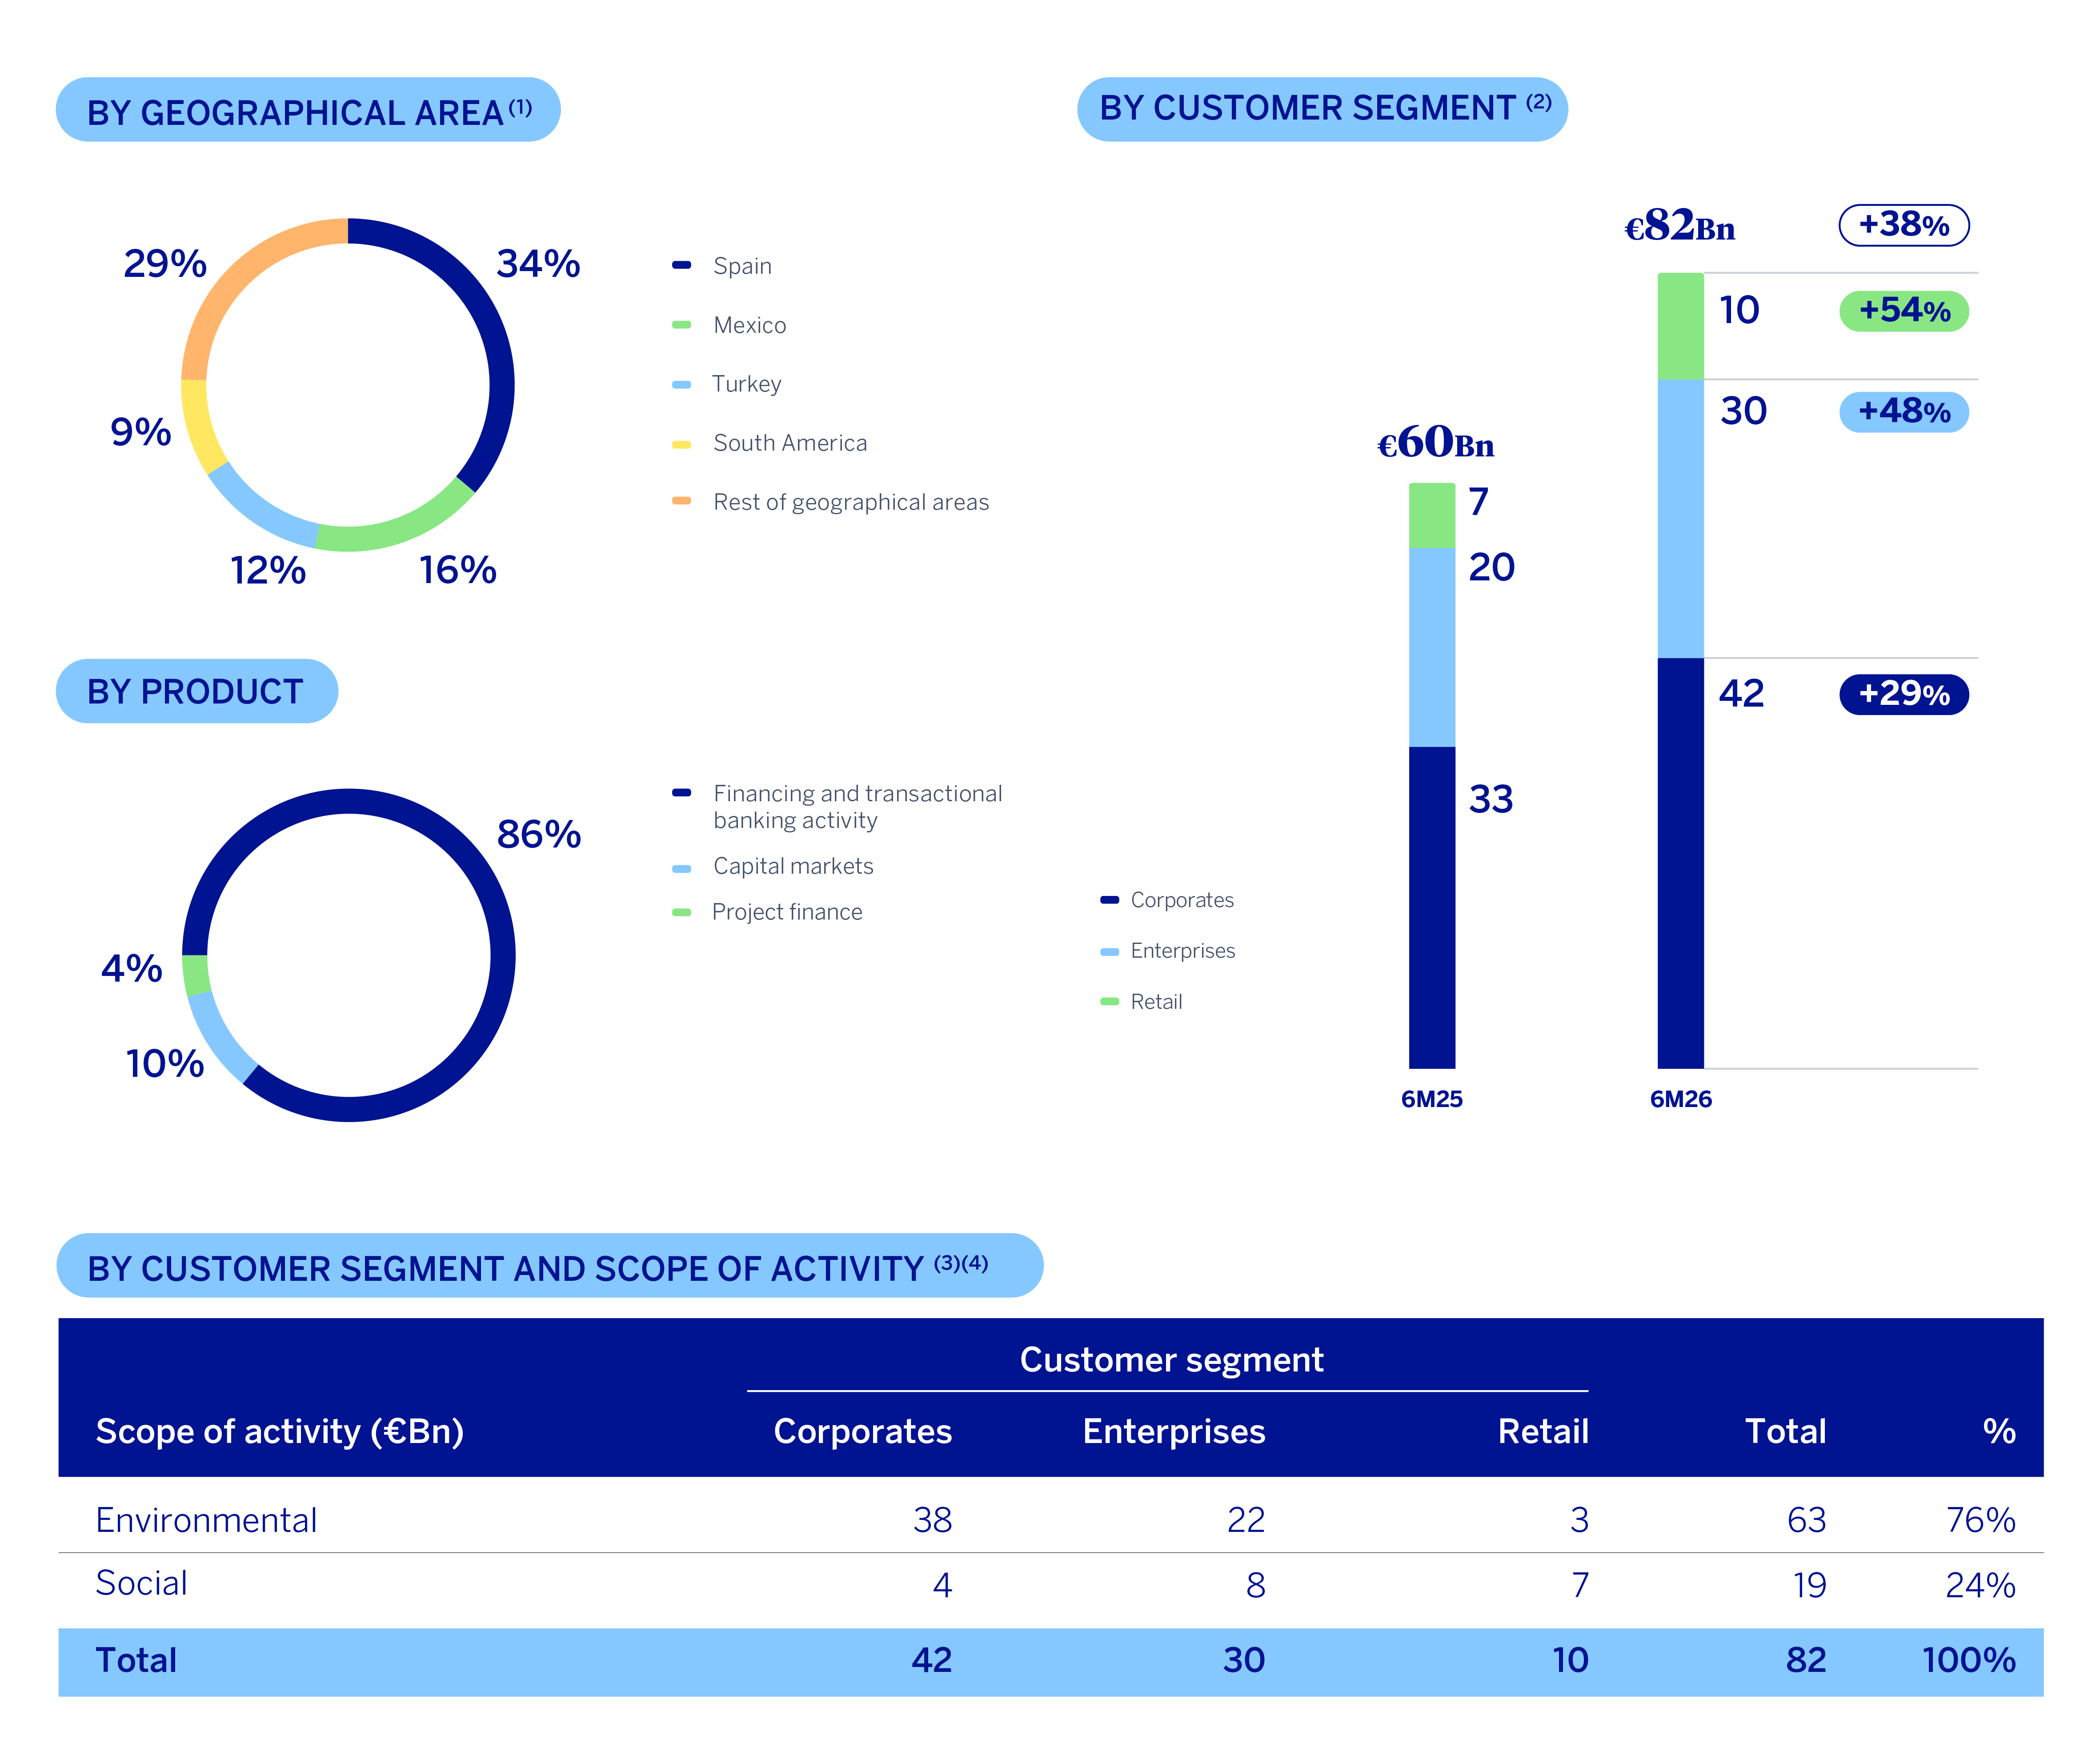
(1) Generally, the criterion used for distributing sustainable business channeling by geographical area is the location of the corresponding operation's registration. However, there are certain exceptions when several geographies are involved in the operation.
(2) At current exchange rates.
(3) In cases where data granularity does not allow for a direct attribution between the scope of activity, internal estimation models based on the best available information are applied. For reporting purposes, the “Environment” category integrates activities related to climate change and natural capital.
(4) The amounts indicated have been rounded; therefore, the amounts or variations shown may not be the exact arithmetic sum of the figures that precede them.
4 The Goal 2029 includes the channeling of financial flows, cumulatively, in relation with activities, clients or products considered to be sustainable, or promoting sustainability, in accordance with internal standards inspired by existing regulations, market standards such as the Green Bond Principles, the Social Bond Principles, the Climate Transition Finance Handbook and Climate Transition Bond Guidelines and the Sustainability Linked Bond Principles of the International Capital Markets Association, as well as the Green Loan Principles, Social Loan Principles, Guide to Transition Loans and the Sustainability Linked Loan Principles of the Loan Market Association, and best market practices. The foregoing is understood without prejudice to the fact that said channeling, both at an initial stage or at a later time, may not be registered on the balance sheet. The products and eligibility and accounting criteria are described in the Guide for Sustainable Business Channeling available on the BBVA Group's shareholders and investors website.
Read more
In the first half of 2026, the BBVA Group has continued to make significant progress in the execution of its 2025-2029 Strategic Plan, which aims to establish a new axis of differentiation by radically incorporating the customer perspective, as well as driving and strengthening the Group's commitment to growth and value creation.
BBVA is firmly betting on artificial intelligence as a key driver for achieving these goals, amplify their impact, and thus continue to lead the transformation of the sector. To accelerate this evolution across the organization, the Bank has created the new AI Transformation unit , an initiative that reinforces its commitment to integrating artificial intelligence across the entire Organization.
STRATEGIC PRIORITIES
BBVA has established six Strategic Priorities to advance its strategy. These Priorities form the framework for implementing the 2025–2029 Strategic Plan.
Thanks to the strong execution of the Strategic Plan, BBVA continues to make progress in achieving the financial targets defined for the 2025-2028 period.
BBVA GROUP FINANCIAL KPIS GOALS EVOLUTION
(1) Compound Annual Growth Rate.
(2) Excluding the effect of Share Buybacks.
Read more
The BBVA Group achieved a cumulative result of €6,051 million at the end of the first half of 2026, representing an increase of 11.1% over the previous year, supported by the strong performance of recurring revenues from the banking business.
The profit for the first half has been mainly favored by the solid evolution of net interest income, which increased by 20.3%, with a positive performance in all business areas. This growth has been able to offset the higher operating expenses, which increased by 17.9%, and the provisions for impairment on financial assets, which grew by 26.6% compared to the accumulated balances as of June 30, 2025, in a context of loan growth. In addition, net fees and commissions, which together with net interest income make up the recurring revenues of the banking business, grew at a year-on-year rate of 14.0%.
NET ATTRIBUTABLE PROFIT (LOSS) (MILLIONS OF EUROS)
Read more
Regarding activity, during the first half of 2026, loans and advances to customers increased by 10.6%, driven for another quarter by the dynamism of the wholesale segment. Within this, the increased volume of business loans stands out, growing by 13.0% at the Group level. Loans to individuals increased by 7.0%, with a favorable evolution across all products.
Customer funds registered an increase of 6.9% so far this year, with a growth of 6.1% in customer deposits, and of 8.7% in off-balance sheet funds at the Group level.
LOANS AND ADVANCES TO CUSTOMERS AND TOTAL CUSTOMER FUNDS (VARIATION COMPARED TO 31-12-2025)
(1) The growth of performing loans and advances to customers under management (excluding repos) stands at 11.2%.
Read more
The BBVA Group's CET12 ratio stood at 12.90% as of June 30, 2026, which allows it to maintain a large management buffer over the Group's CET1 requirement as of that date (8.98%3), and is also above the Group's target management range of 11.5% - 12.0% of CET1.
CET1 RATIO
(1) Considering the latest official updates to the countercyclical capital buffer and the systemic risk buffer, applied on the basis of exposure as of March 31, 2026.
2 As of June 30, 2026, there were no differences between fully loaded and phased-in ratios given that the impact associated with the transitional adjustments is nil.
3 Considering the latest official updates to the countercyclical capital buffer and the systemic risk buffer, applied on the basis of exposure as of March 31, 2026.
Read more
BBVA is driving sustainability as a differential growth engine. Within the framework of its ambitious target of channeling €700 billion into sustainable business for the 2025–2029 period4, the BBVA Group has channeled approximately €82 billion in the first six months of 2026, bringing the cumulative total to €216 billion since the announcement of this new target.
SUSTAINABLE BUSINESS CHANNELING 2025–JUNE 2026
SUSTAINABLE BUSINESS CHANNELING 6M26
(1) Generally, the criterion used for distributing sustainable business channeling by geographical area is the location of the corresponding operation's registration. However, there are certain exceptions when several geographies are involved in the operation.
(2) At current exchange rates.
(3) In cases where data granularity does not allow for a direct attribution between the scope of activity, internal estimation models based on the best available information are applied. For reporting purposes, the “Environment” category integrates activities related to climate change and natural capital.
(4) The amounts indicated have been rounded; therefore, the amounts or variations shown may not be the exact arithmetic sum of the figures that precede them.
4 The Goal 2029 includes the channeling of financial flows, cumulatively, in relation with activities, clients or products considered to be sustainable, or promoting sustainability, in accordance with internal standards inspired by existing regulations, market standards such as the Green Bond Principles, the Social Bond Principles, the Climate Transition Finance Handbook and Climate Transition Bond Guidelines and the Sustainability Linked Bond Principles of the International Capital Markets Association, as well as the Green Loan Principles, Social Loan Principles, Guide to Transition Loans and the Sustainability Linked Loan Principles of the Loan Market Association, and best market practices. The foregoing is understood without prejudice to the fact that said channeling, both at an initial stage or at a later time, may not be registered on the balance sheet. The products and eligibility and accounting criteria are described in the Guide for Sustainable Business Channeling available on the BBVA Group's shareholders and investors website.
Read more
Business Areas
Click on each area to learn more
Spain
Spain
HIGHLIGHTS FOR THE PERIOD
|
RESULTS
| |
| Net interest income | Gross income |
| 3,346 | 5,147 |
| +4.1% (2) | +3.1% (2) |
| Operating income | Net atributable profit |
| 3,417 | 2,172 |
| -0.1%(2) | +2.3% (2) |
ACTIVITY (1)
|
|
| Variation compared 31-12-25. Balances as of 30-06-26. |
|
| Performing loans and advances to customers under management | Customer funds under management |
| +4.5% | +2.5% |
RISKS |
| NPL coverage ratio |
| 67% | 71% |
| NPL ratio |
| 3.0% | 2.9% |
| Cost of risk |
| 0.34% | 0.31% |
(2) Year-on-year changes.
Mexico
Mexico
HIGHLIGHTS FOR THE PERIOD
|
RESULTS
| |
| Net interest income | Gross income |
| 6,409 | 8,565 |
| +8.6% (2) | +8.9% (2) |
| Operating income | Net atributable profit |
| 5,931 | 2,979 |
| +8.8% (2) | +8.2% (2) |
ACTIVITY (1)
|
|
| Variation compared 31-12-25. Balances as of 30-06-26. |
|
| Performing loans and advances to customers under management | Customer funds under management |
| +4.8% | +4.1% |
RISKS |
| NPL coverage ratio |
| 124% | 118% |
| NPL ratio |
| 2.7% | 2.8% |
| Cost of risk |
| 3.31% | 3.26% |
(2) Year-on-year changes.
Turkey
Turkey
HIGHLIGHTS FOR THE PERIOD
|
RESULTS
| |
| Net interest income | Gross income |
| 2,152 | 3,372 |
| +84.1% (2) | +62.8% (2) |
| Operating income | Net atributable profit |
| 2,004 | 532 |
| +81.2% (2) | +74.3% (2) |
ACTIVITY (1)
|
|
| Variation compared 31-12-25. Balances as of 30-06-26. |
|
| Performing loans and advances to customers under management | Customer funds under management |
| +15.5% | +13.0% |
RISKS |
| NPL coverage ratio |
| 76% | 75% |
| NPL ratio |
| 3.9% | 4.1% |
| Cost of risk |
| 1.94% | 2.36% |
(2) Year-on-year changes.
South America
South America
HIGHLIGHTS FOR THE PERIOD
|
RESULTS
| |
| Net interest income | Gross income |
| 2,952 | 3,308 |
| +28.6% (2) | +26.7% (2) |
| Operating income | Net atributable profit |
| 1,936 | 556 |
| +33.5% (2) | +41.6% (2) |
ACTIVITY (1)
|
|
| Variation compared 31-12-25. Balances as of 30-06-26. |
|
| Performing loans and advances to customers under management | Customer funds under management |
| +6.9% | +8.8% |
RISKS |
| NPL coverage ratio |
| 92% | 89% |
| NPL ratio |
| 4.0% | 4.0% |
| Cost of risk |
| 2.50% | 2.69% |
(2) Year-on-year changes.
Rest of business
Rest of business
HIGHLIGHTS FOR THE PERIOD
|
RESULTS
| |
| Net interest income | Gross income |
| 507 | 1,197 |
| +36.0% (2) | +44.1% (2) |
| Operating income | Net atributable profit |
| 699 | 508 |
| +54.3% (2) | +60.0% (2) |
ACTIVITY (1)
|
|
| Variation compared 31-12-25. Balances as of 30-06-26. |
|
| Performing loans and advances to customers under management | Customer funds under management |
| +28.1% | -0.6% |
RISKS |
| NPL coverage ratio |
| 172% | 89% |
| NPL ratio |
| 0.2% | 0.3% |
| Cost of risk |
| 0.15% | 0.14% |
(2) Year-on-year changes.
* Gross income.
(1) At constant exchange rate.
(2) At constant exchange rates.
According to the accumulated results of the business areas at the end of June 2026, and excluding the evolution of currencies in each of them, it is worth mentioning:
Spain generated a net attributable profit of €2,172 million, in the first half of 2026 which is, 2.3% above the result achieved in the same period of 2025, driven by the evolution of the net interest income, supported by the dynamism of lending activity in all customer segments and the net trading income (hereinafter NTI).
BBVA Mexico achieved a net attributable profit of €2,979 million, which represents a year-on-year growth of 8.2%, explained mainly by the favorable evolution of net interest income, supported by robust lending activity growth and driven also by the rest of components of gross income.
Turkey reached a net attributable profit of €532 million, with a year-on-year growth of 29.1%, as a result mainly of the good performance of recurring income from the banking business (net interest income and fees).
South America generated a net attributable profit of €556 million, which represents a year-on-year growth of 33.6%, favored by the evolution of recurring revenues in the banking business.
Rest of Business achieved a net attributable profit of €508 million in the first half of 2026, 60.0% higher than in the same period of the previous year, favored by the evolution of the recurring revenues and the NTI.
The Corporate Center recorded in the first half of 2026 a net attributable loss of €-696 million which represents a worsening compared to the same period of the previous year, associated with the lower contribution of the NTI and higher personnel expenses.
Lastly, and for a better understanding of the Group's activity and results, supplementary information is provided below for the wholesale business, Corporate & Investment Banking (CIB), carried out by BBVA in the countries where it operates. CIB generated a net attributable profit of €2,054 million in the first half of 20265. Excluding the impact of currency fluctuations, this result represents a 20.7% increase over the previous year, which reflects again the strength of the Group's wholesale businesses, with the aim of offering a value proposition focused on the needs of its customers.
NET ATTRIBUTABLE PROFIT BREAKDOWN (1)
(PERCENTAGE. 6M26)
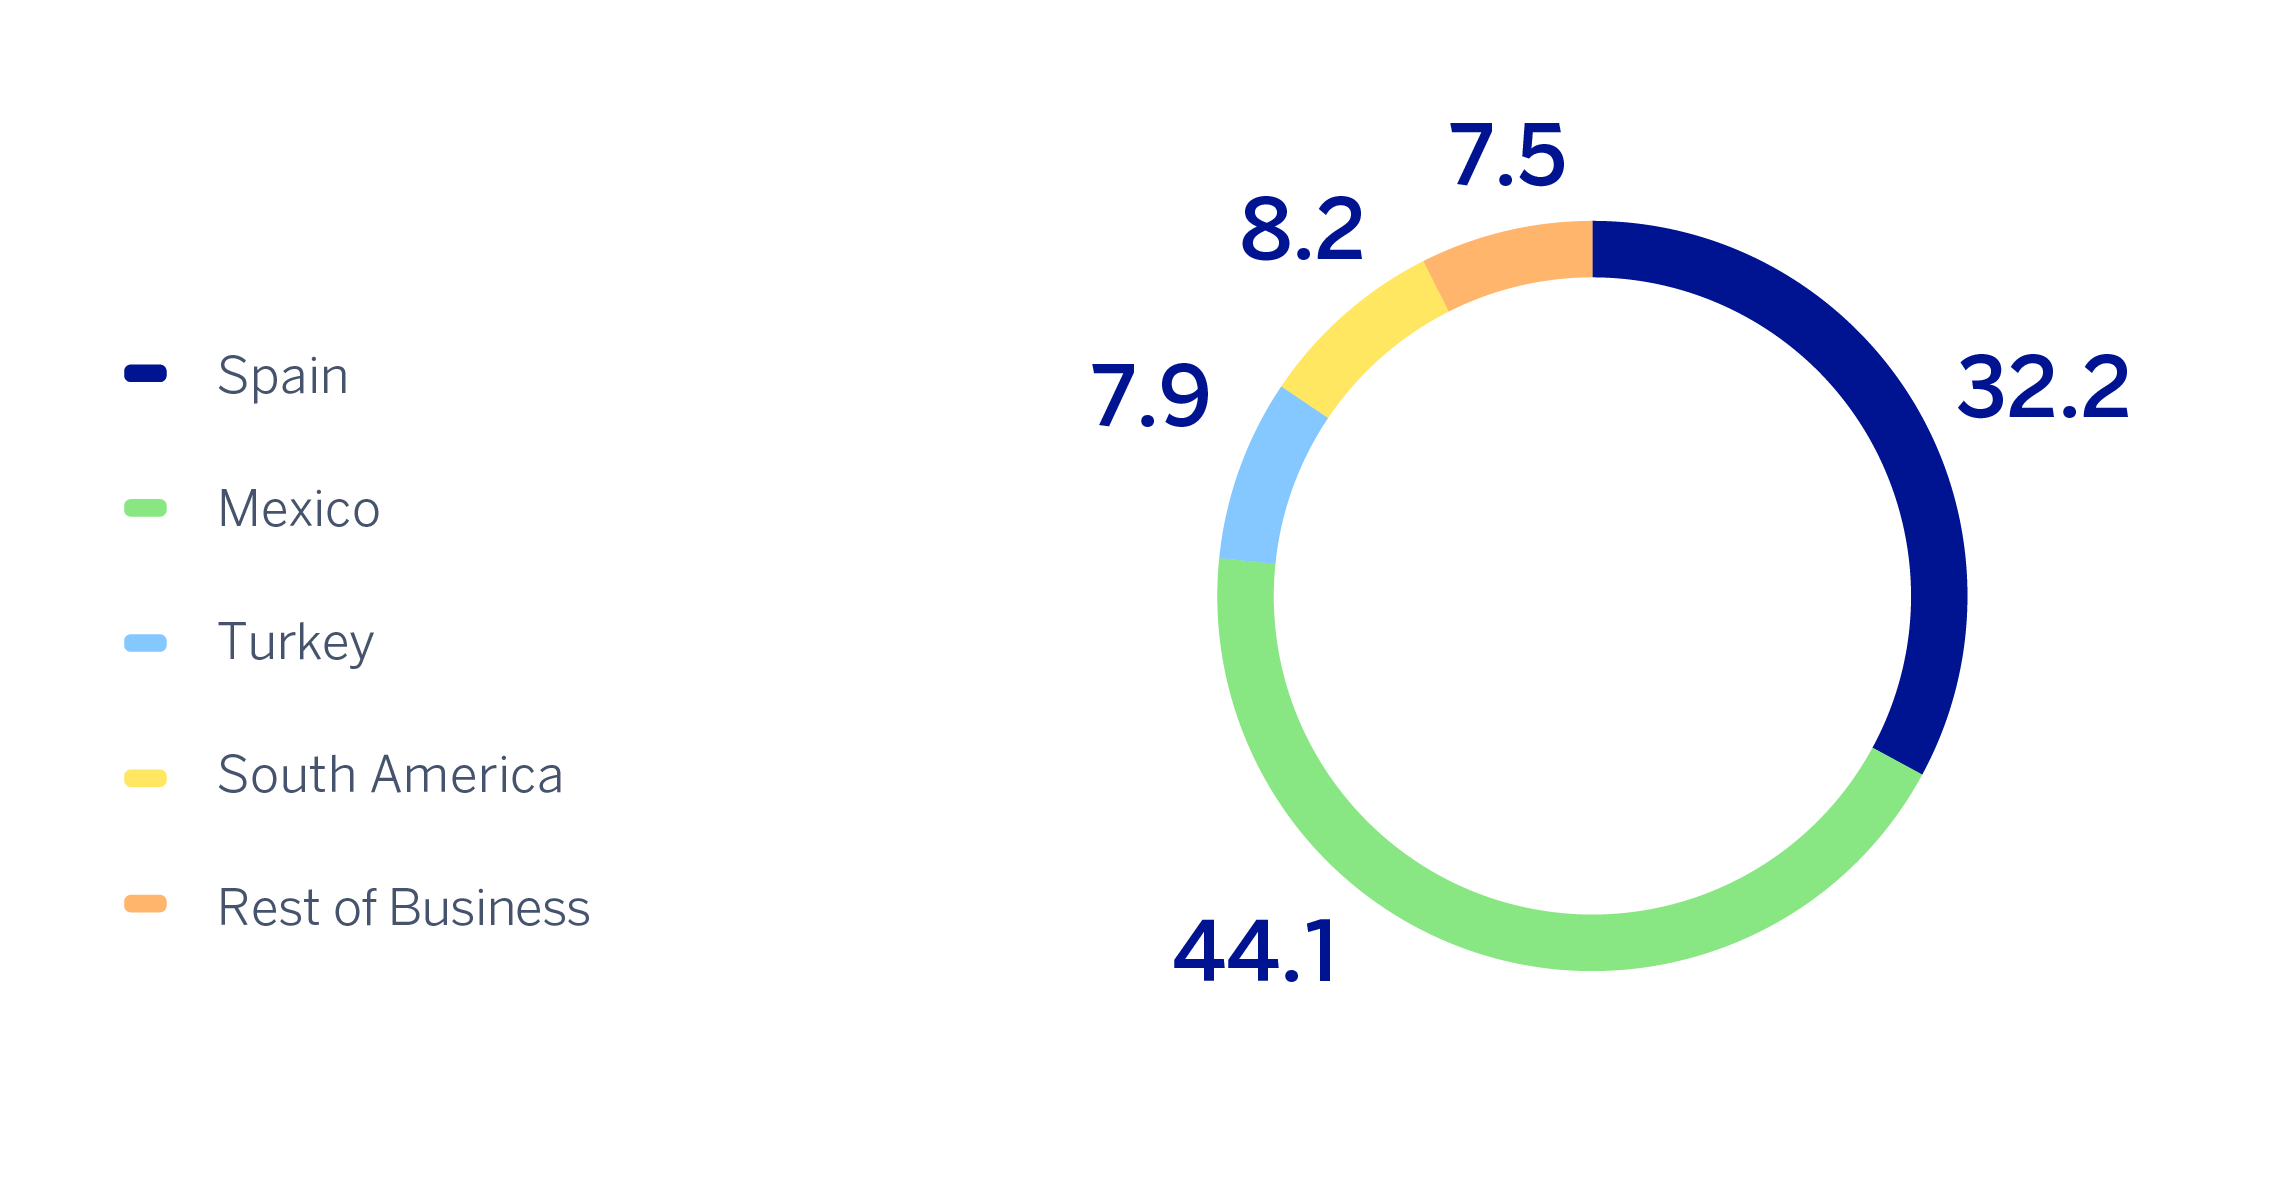
(1) Excludes the Corporate Center.
5 The additional pro forma information from CIB excludes the application of hyperinflation accounting and the Group's wholesale business in Venezuela.
Read legal disclaimer of this report.
News
Contact
 Shareholder attention line
912 24 98 21
 Subscription service
 Shareholder Office
 Contact email